
Trust the output
You can trust
the answers
Every answer is built the same way: a plan you approve, queries on your own data and an engine that keeps the AI away from the arithmetic and checks every figure. The evidence is one click away, so you can inspect the working before you act. Here is the chain, link by link.
The Insights Engine Patent pending
The AI never does the arithmetic.
That is the point.
The Insights Engine keeps two jobs strictly apart. The AI decides what to ask and how to say it. Your data produces every number. And every number the AI cites is checked back against the data that produced it before it can appear.
The AI plans and writes
It turns your question into steps, writes the queries and drafts the findings. It never executes a query, never calculates a figure and never types a number into the text.
Your data answers
The queries run against your data and every result is stored as a fact: the value, the table it came from and the query that produced it.
Every figure is re-checked
Each finding is verified against the stored facts by a separate pass. The numbers you read are the stored values themselves, placed into the text, not retyped.
Data validation
As each step runs, its method is checked before the results are accepted: the right table, the right filter, consistent units, denominators and scales and agreement with the facts already established. A step that fails is redone.
Evidence verification
When the findings are written, every figure in every sentence is re-queried against the stored facts by a separate checker. A finding is kept, reworded to match the evidence, or removed. Nothing unverified reaches the slide.
Coherence check
The accepted findings are then read against each other across the whole analysis, so a ranking on one slide cannot contradict a comparison on another. Conflicts are resolved or removed before you see them.
The words between the figures contain no numbers at all. If a figure is on the slide, it was produced by a query, stored as a fact, checked and then placed there. That separation is the subject of our patent application.
The source
Where do the numbers come from?
From your data, through queries you can read. Dactana turns your question into a plan, you approve it, and every step runs as a structured query where the data lives.
You approve the plan before anything runs
The plan lists each step and what it will produce. Add the extras you want, drop what you do not, answer any clarifying question, then go. Nothing runs that you have not seen.
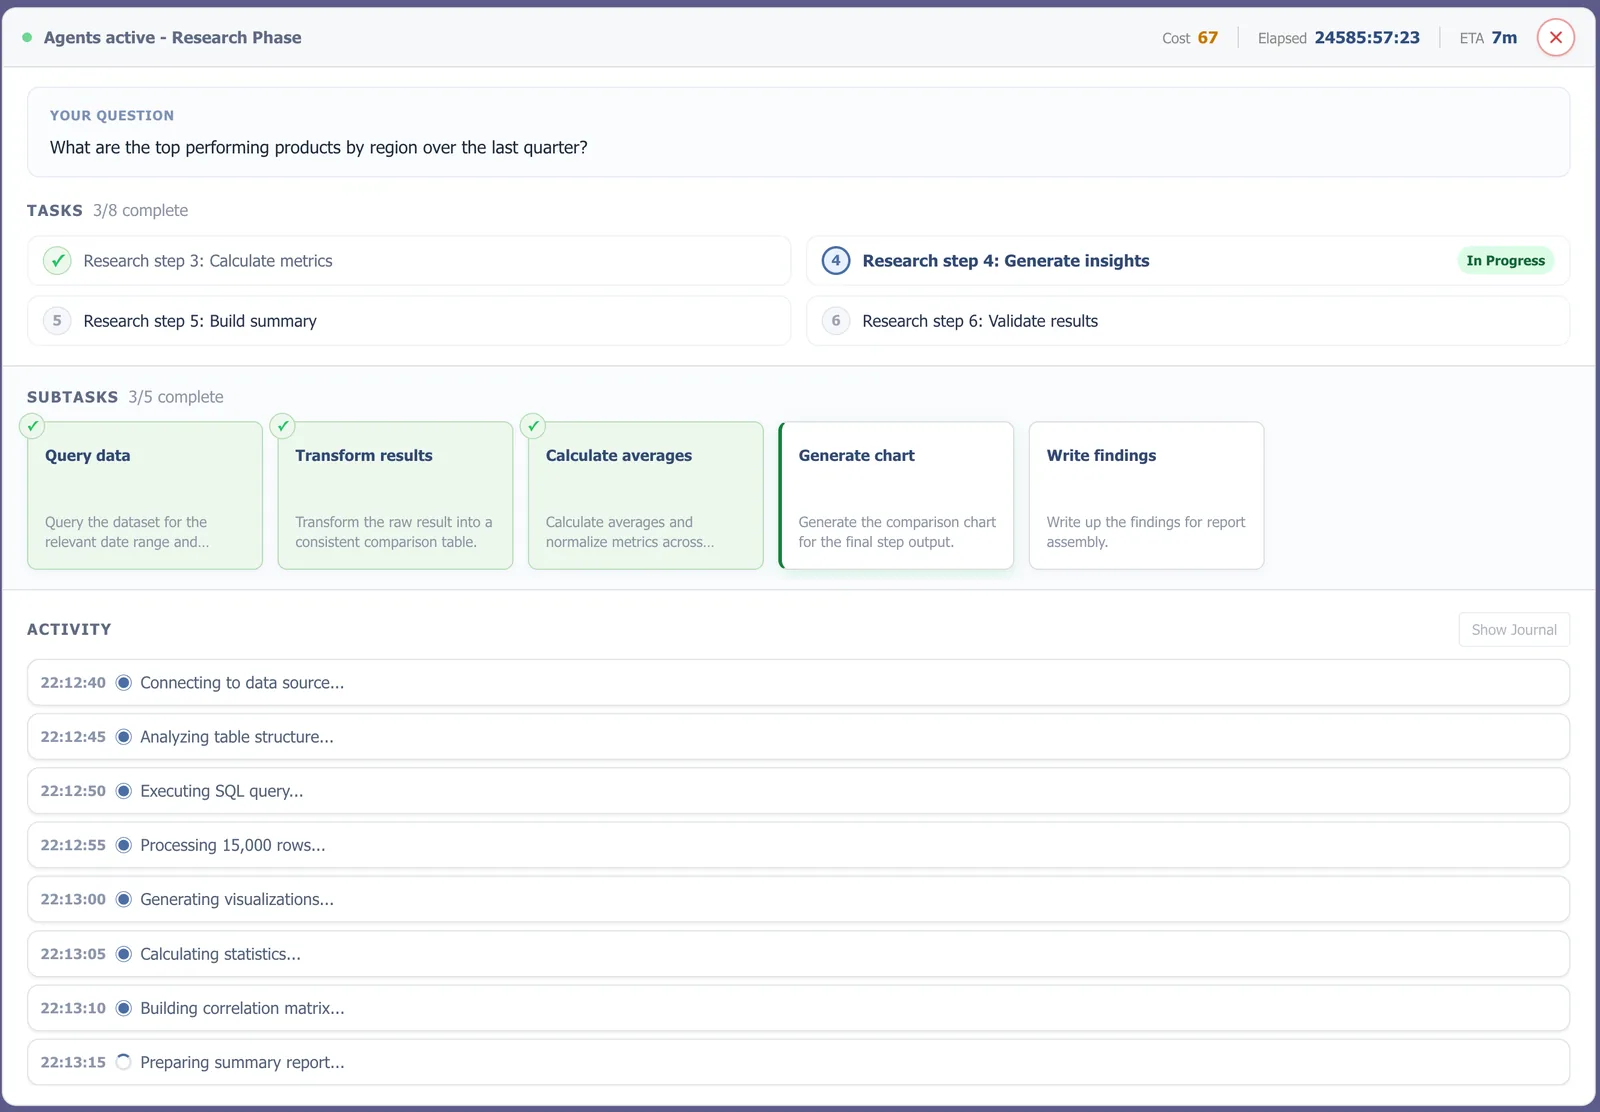
Watch it run, step by step
Every task, subtask and query shows as it happens. The figures on the final slides are the results of those queries, not a summary written afterwards.
- No generated numbers. A figure exists because a query returned it.
- Read-only on your warehouse, with row limits and timeouts.
The check
Who checks them?
A second pass, before you see anything. This walkthrough uses findings from a real fleet analysis: one verified with the checker's own reasoning, one it failed, corrected and passed.
Every number comes from a query
Figures are produced by structured queries run directly against your data. The AI plans and explains; it does not generate or estimate a number.
A second pass checks each finding
Before a finding can appear, a separate check re-runs the key numbers behind it and reads the statement against them. Findings that fail are corrected or removed and you can read the reasoning.
One method, locked before it runs
Definitions such as what counts as churn, active or late are fixed before analysis begins and stay identical across every slide, so two figures never disagree by accident.
The working
Can I see the working?
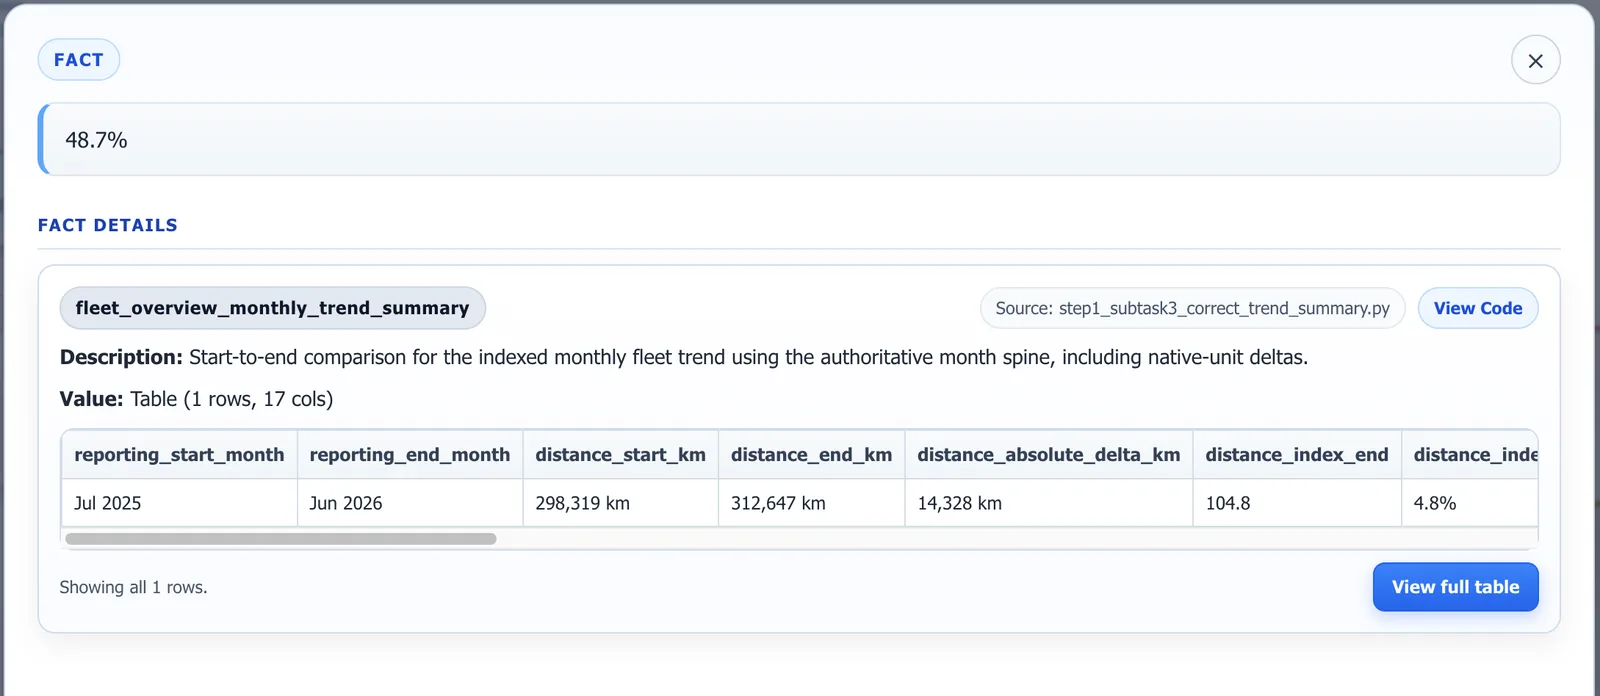
Yes, from the slide. Audit view marks every checked figure and opening one shows the fact behind it.
Down to the fact table
Behind every figure is a fact: the table it came from, the query that produced it and the source it was read from. Open it from the slide and download the table behind any chart as a file.
- Every checked figure marked on the slide
- The table and its source one click away
- Download the data behind any chart or table
The evidence
Are the recommendations backed up?
Every recommendation states what to do, why and the checked findings it rests on. The rationale cites them by number and each citation opens the evidence.
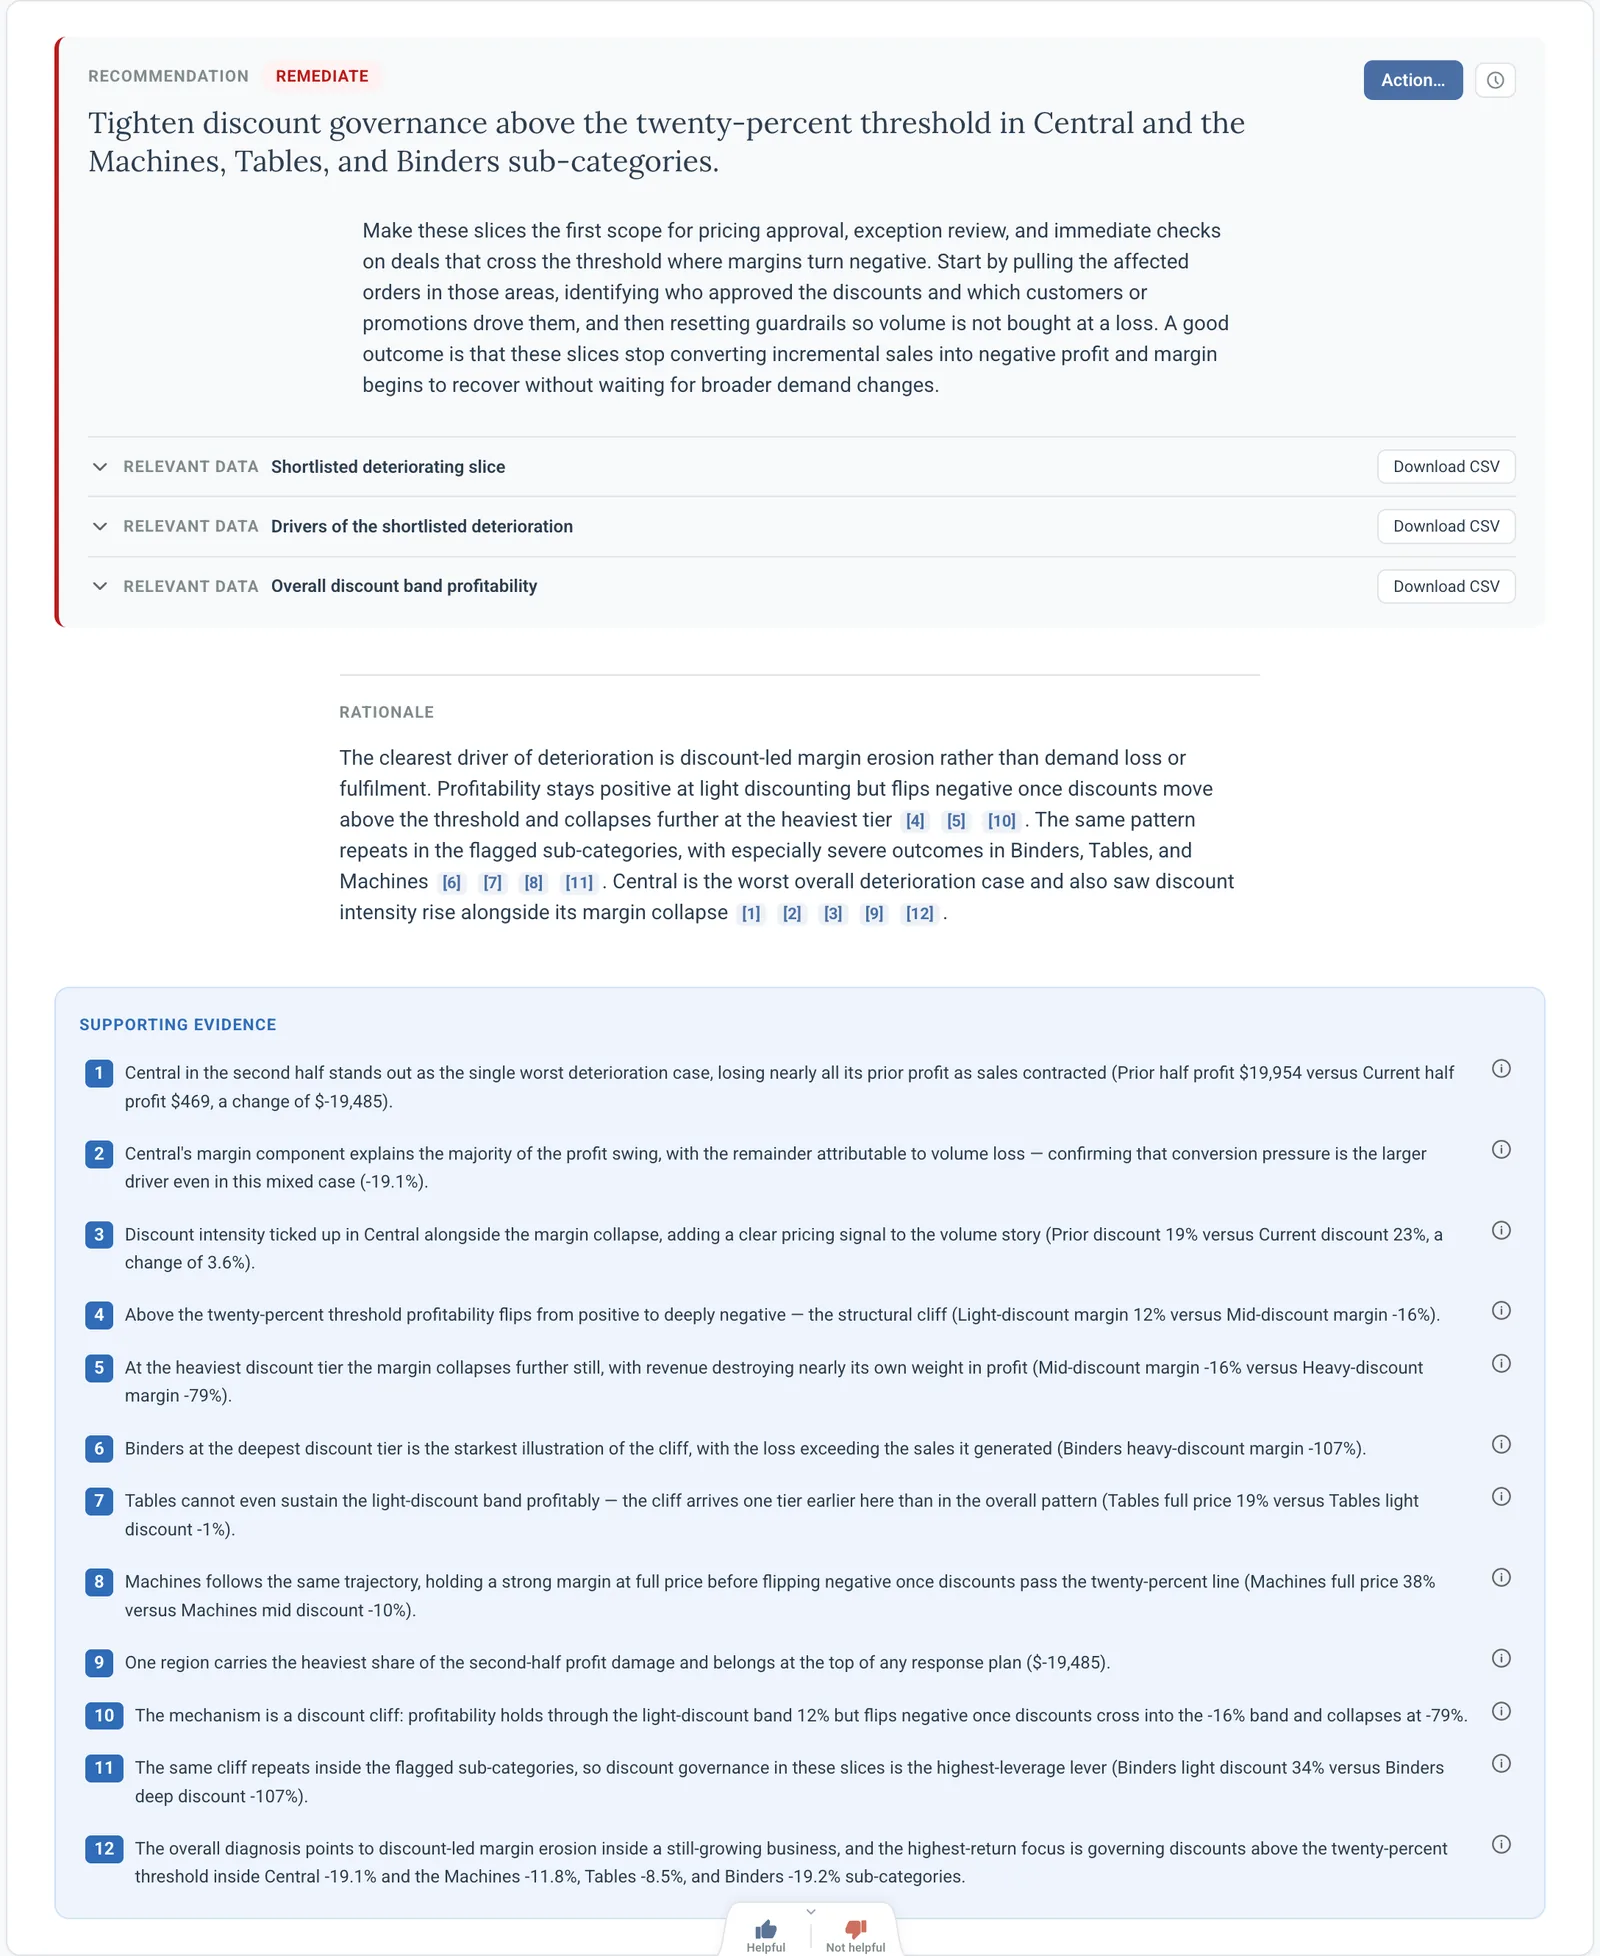
Statement
What to do, in one sentence, with the action it implies.
Rationale, cited
Why, with a numbered reference to every finding it relies on.
Supporting evidence
The findings themselves, each one checked and each one open to inspection.
The limits
What if the data cannot answer?
Then Dactana says so. A confident answer to the wrong question is worse than no answer.
It asks before it guesses
When a question needs a decision from you, such as which date range or which definition of a customer, the plan asks for it before anything runs.
It says what it could not do
If a step cannot be completed from the data, the slide says what was missing instead of filling the gap. A missing figure is reported as missing.
It shows its assumptions
Where an estimate is unavoidable, such as a fuel price or an idling rate, the assumption is printed beside the figure it affects and you can change it.
The challenge
Can my colleagues challenge it?
Share the explorer and the discussion happens next to the evidence, not in a separate thread.
Discuss it where the figures are
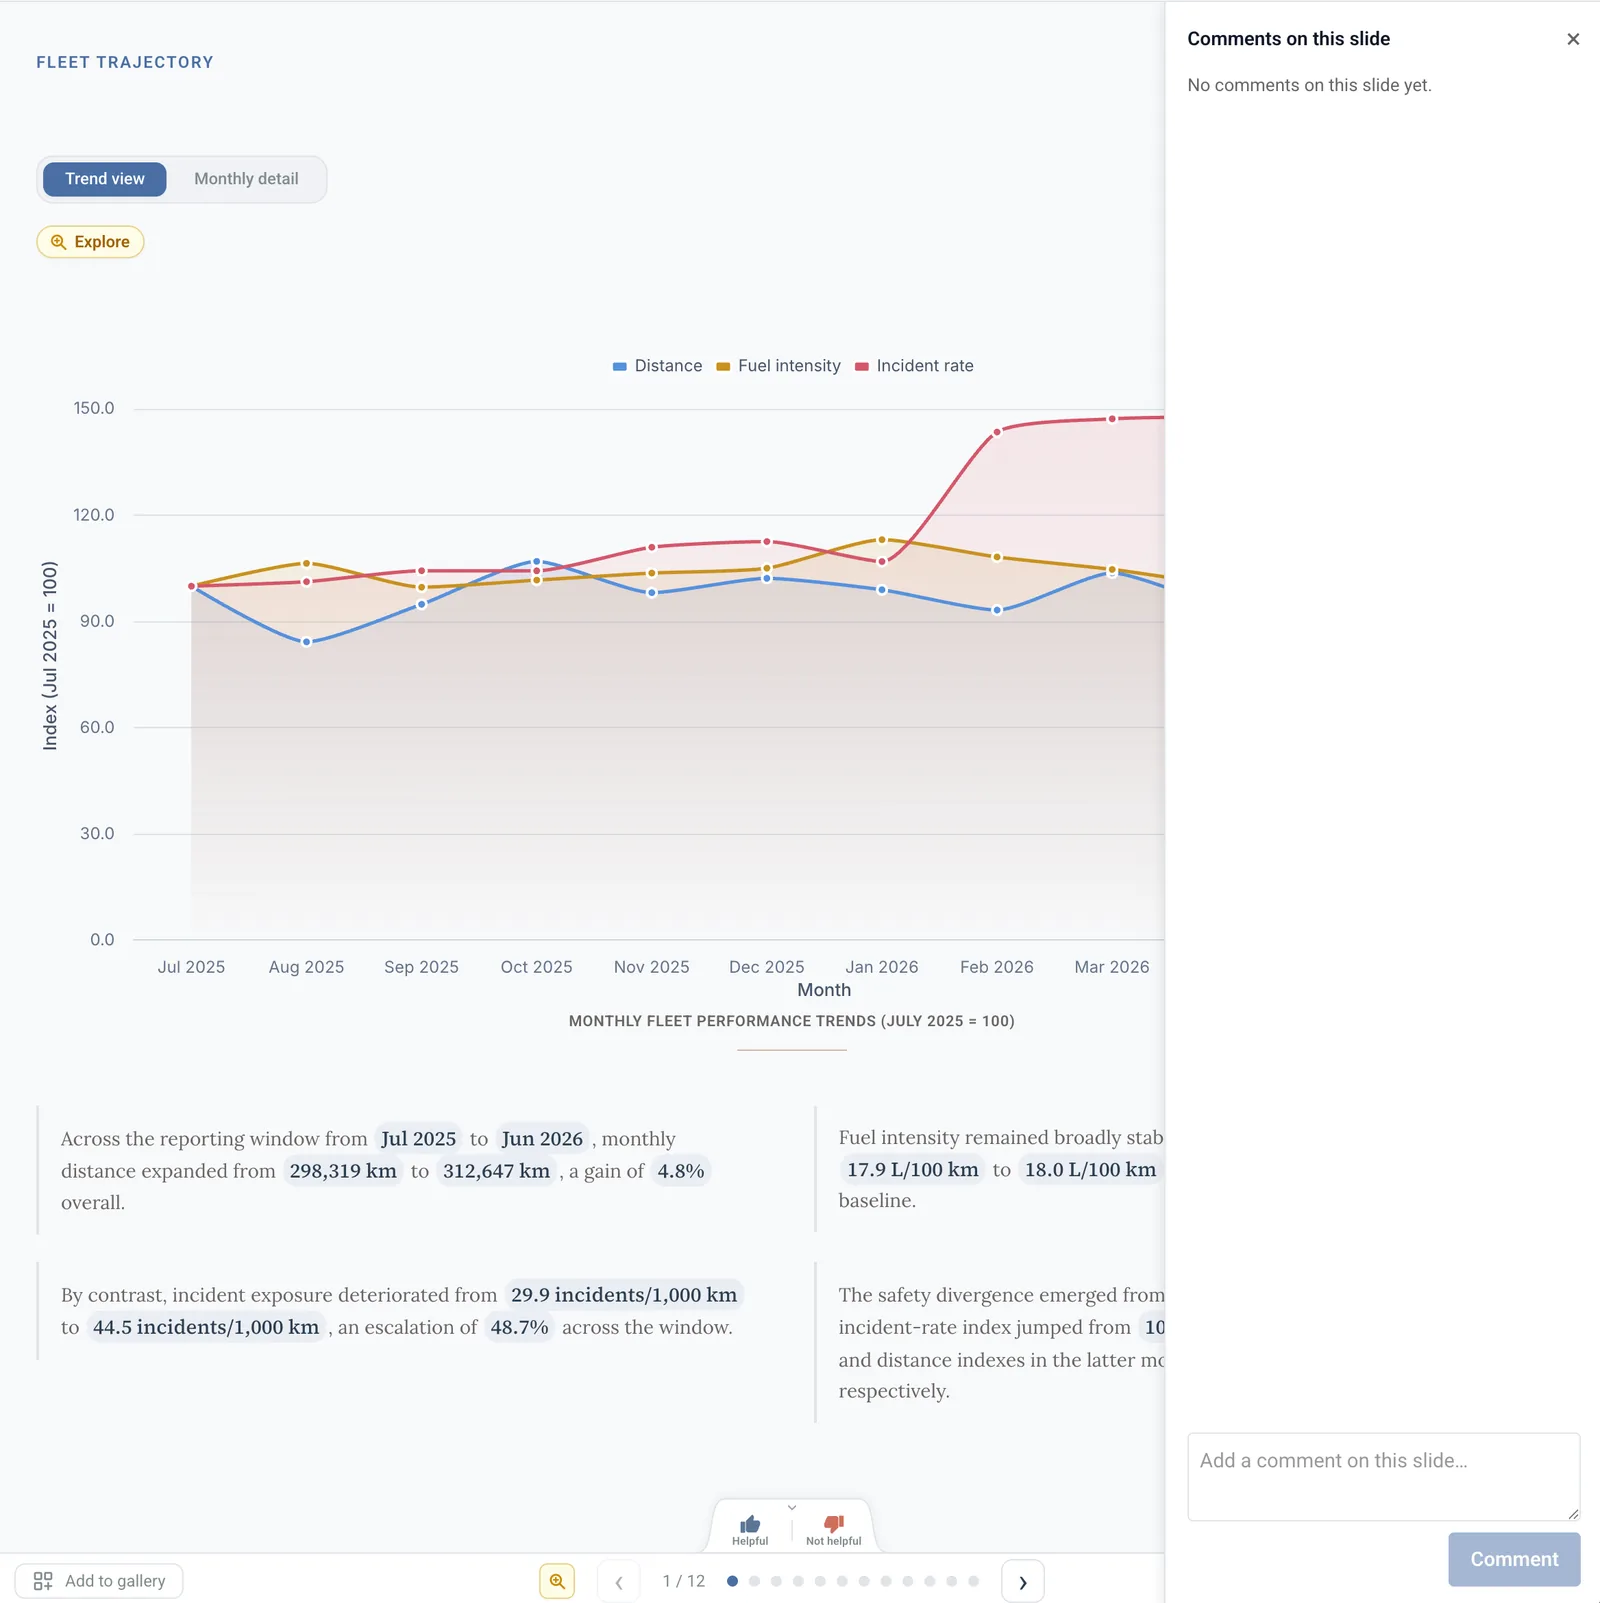
Comments sit beside the slide they are about. A challenge can be answered with a follow-up question launched from the same figure and the answer lands in the same place.
- Comments per slide, visible to everyone the explorer is shared with
- Follow-ups from any figure, tracked until they come back
- Re-run on a schedule, same method, updated data
Common questions
How does Dactana check its numbers?
Every number is produced by a structured query run directly against your data. A separate pass then re-runs the key numbers and reads each finding against them and anything that does not hold is corrected or removed before you see it.
Can we inspect the working?
Yes. Audit view opens the fact behind any figure, with the table it came from and its source. Recommendations cite the findings they rest on and each citation opens the evidence.
Will it give the same answer next month?
The method is fixed before a run starts, so re-running the same question on updated data applies the same definitions. Saved questions can run on a schedule and every run keeps its own record.
What does it do when it is unsure?
It asks. Clarifying questions come before the run, assumptions are shown beside the figures they affect and a step the data cannot support is reported as missing rather than estimated.