
Retail and loyalty
Built for the questions
a retailer asks.
Margin, mix, discounting and the customers behind them, each answered with a component made for the job and each figure checked before you see it. Pick a question.
Deep Dive
Where is the business deteriorating and why?
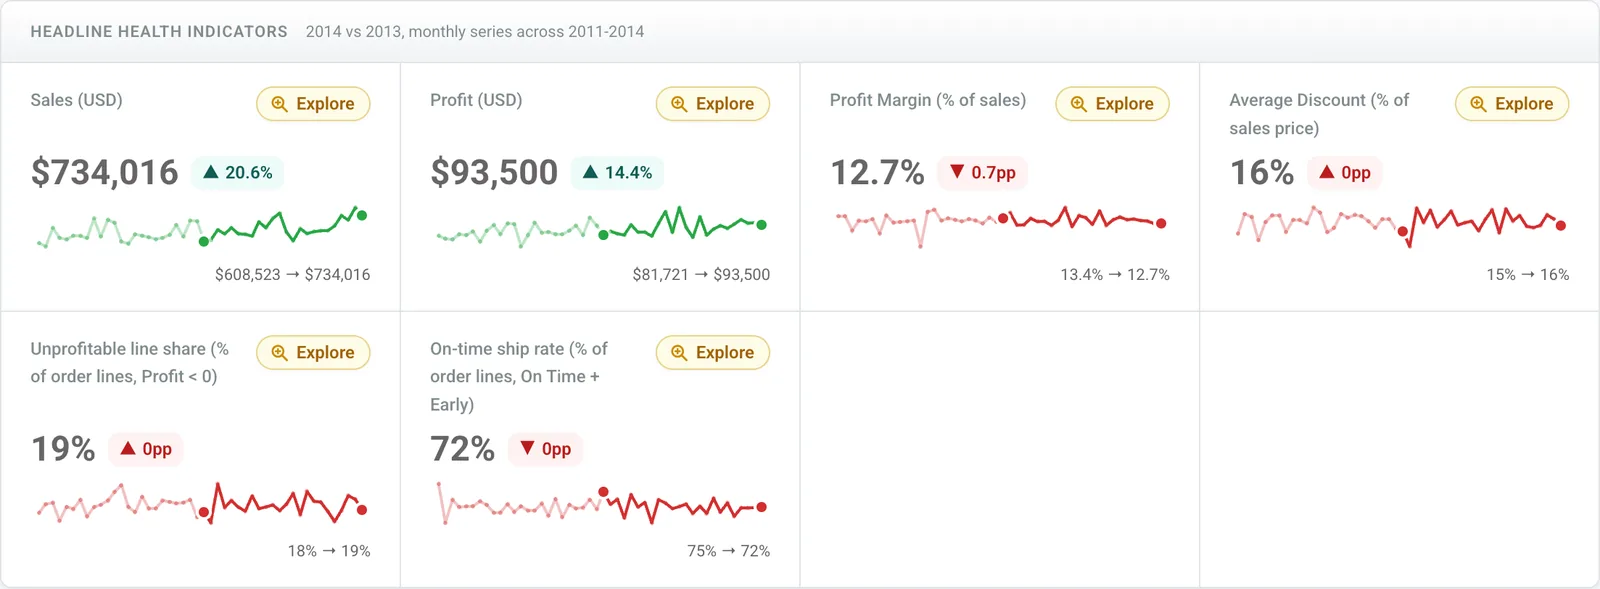
One question, one analysis: the headline health of the business, where the decline sits and what is driving it, with every figure checked on the way.
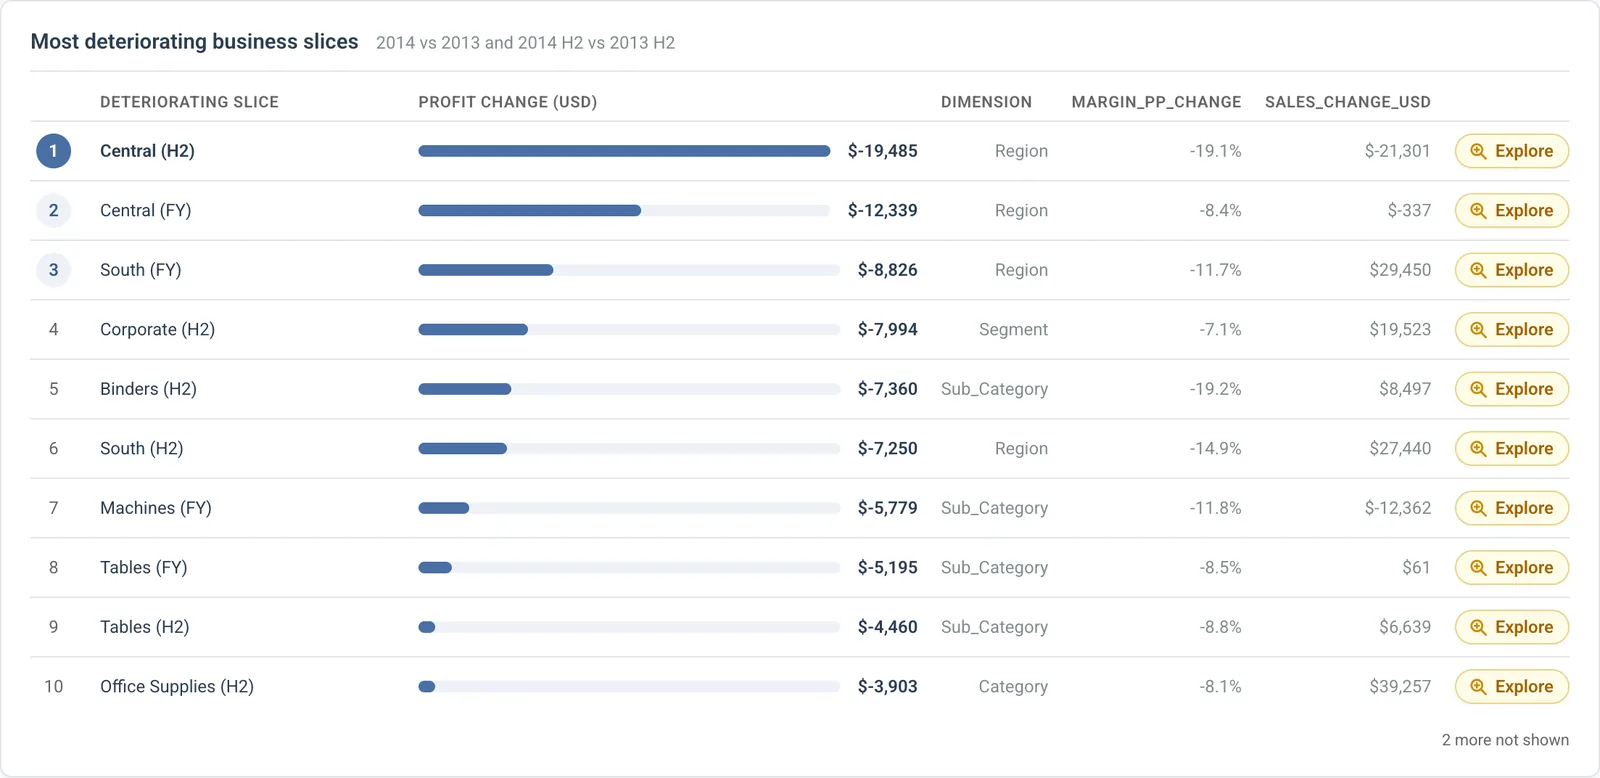
Where the deterioration sits
A leaderboard of categories and regions ranked by how far they have slipped, so the conversation starts with the two that matter rather than the twenty that do not.
- Ranked against the average, not a fixed target
- Every row explorable into its own follow-up
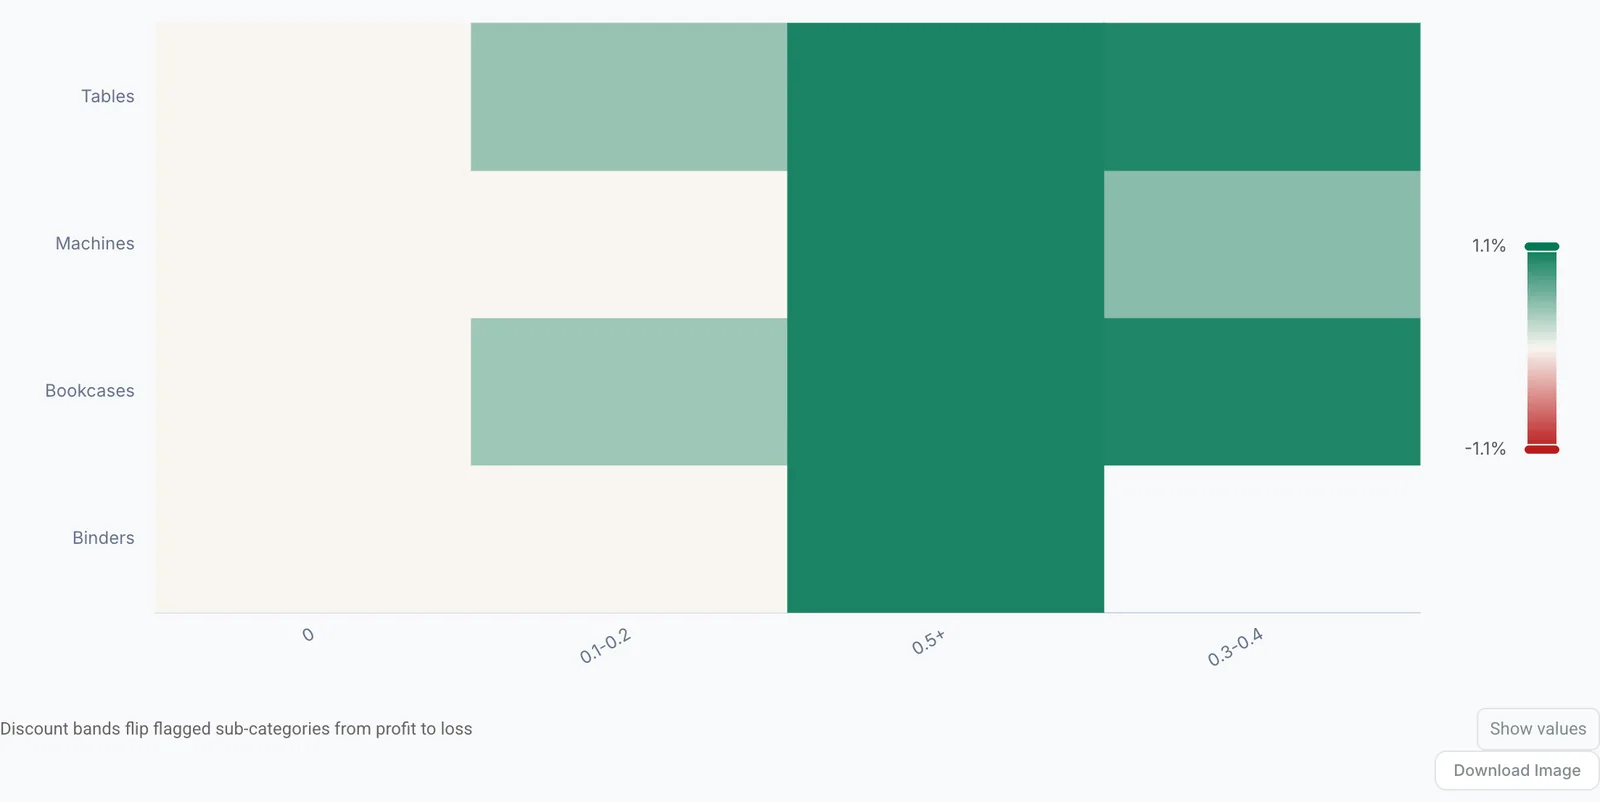
The discount cliff
A heat map of margin by discount band and category shows the point at which discounting stops winning volume and starts losing money. Hover a cell for the figure behind it.
- Discount band against category, shaded by margin
- The cliff edge visible without a model
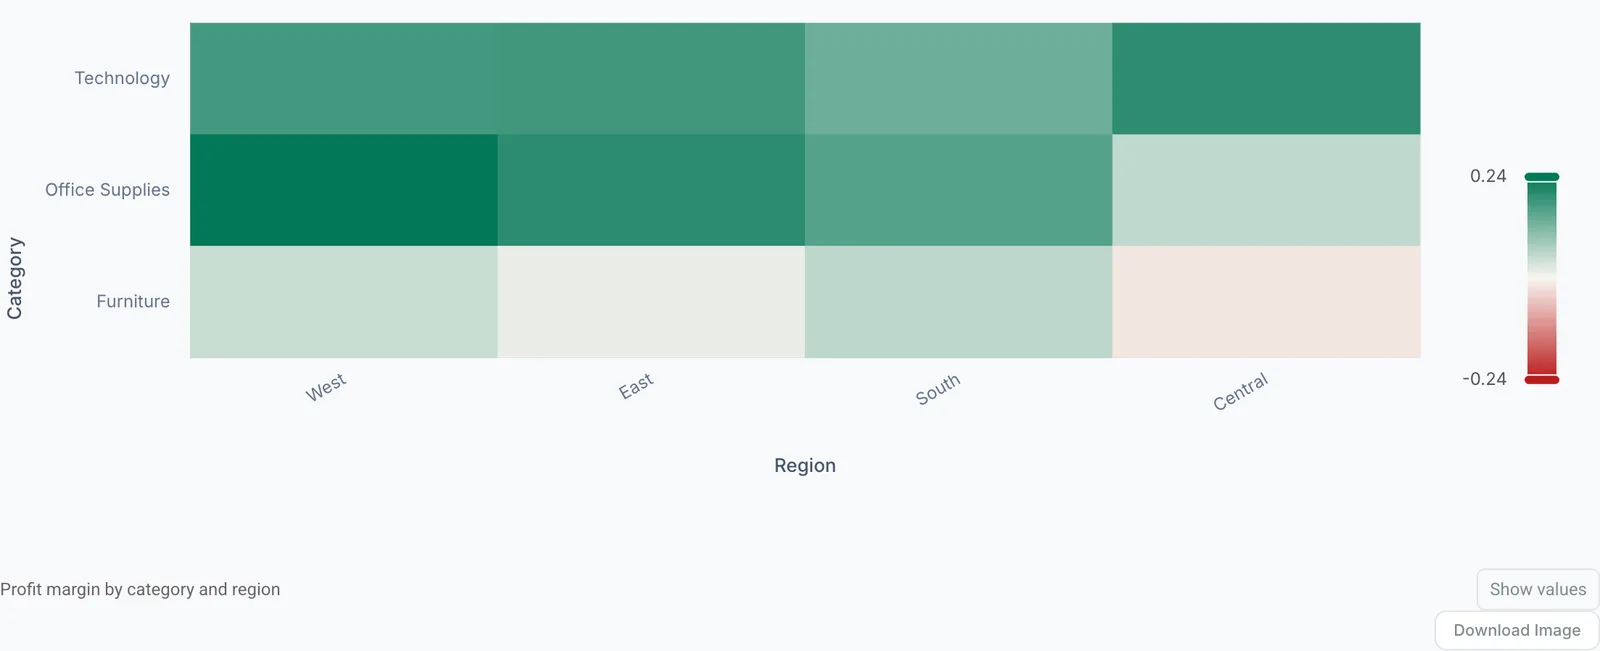
Category and region
Which categories and regions make the profit?
The matrix that every trading meeting draws on a whiteboard, drawn from the orders themselves and kept live. Hover a cell for the margin behind it and open the orders that make it up.
Products
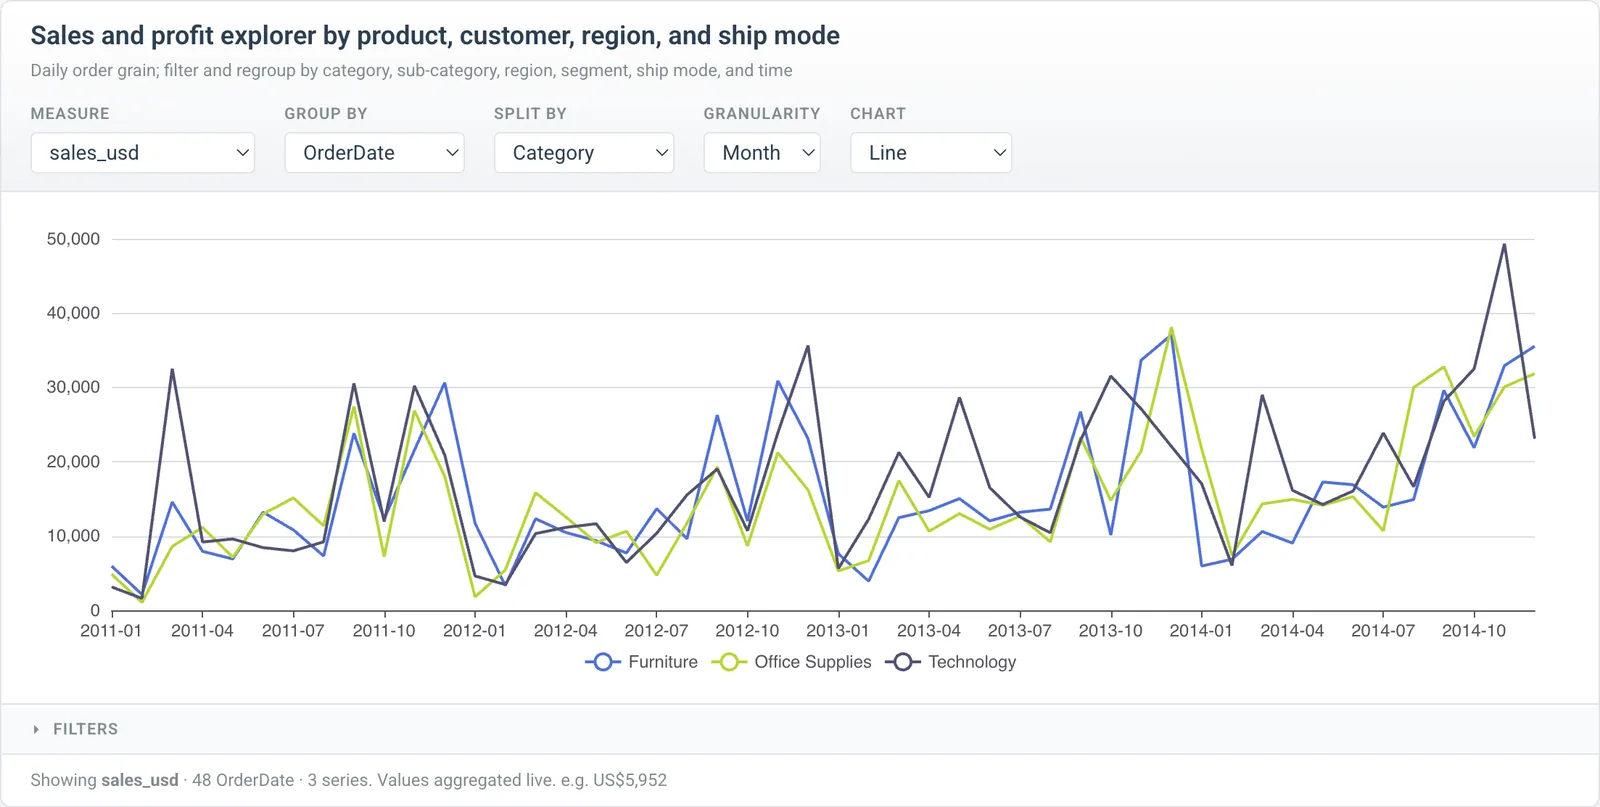
Can I slice it myself?
A pivot chart on the checked data: change the measure, the grouping, the split and the period without leaving the slide and every cut stays tied to the figures the analysis verified.
The plan
How Dactana plans a retail question
Before anything runs, Dactana drafts the steps and shows you what each will produce. Add the extras you want, drop what you do not, then go.
Refine it, then run it
A margin question becomes three steps: margin by category and region, where the deterioration sits and discount depth against profit. Loss-making products join the plan with one click and the complexity gauge shows what that costs.
Recommendations
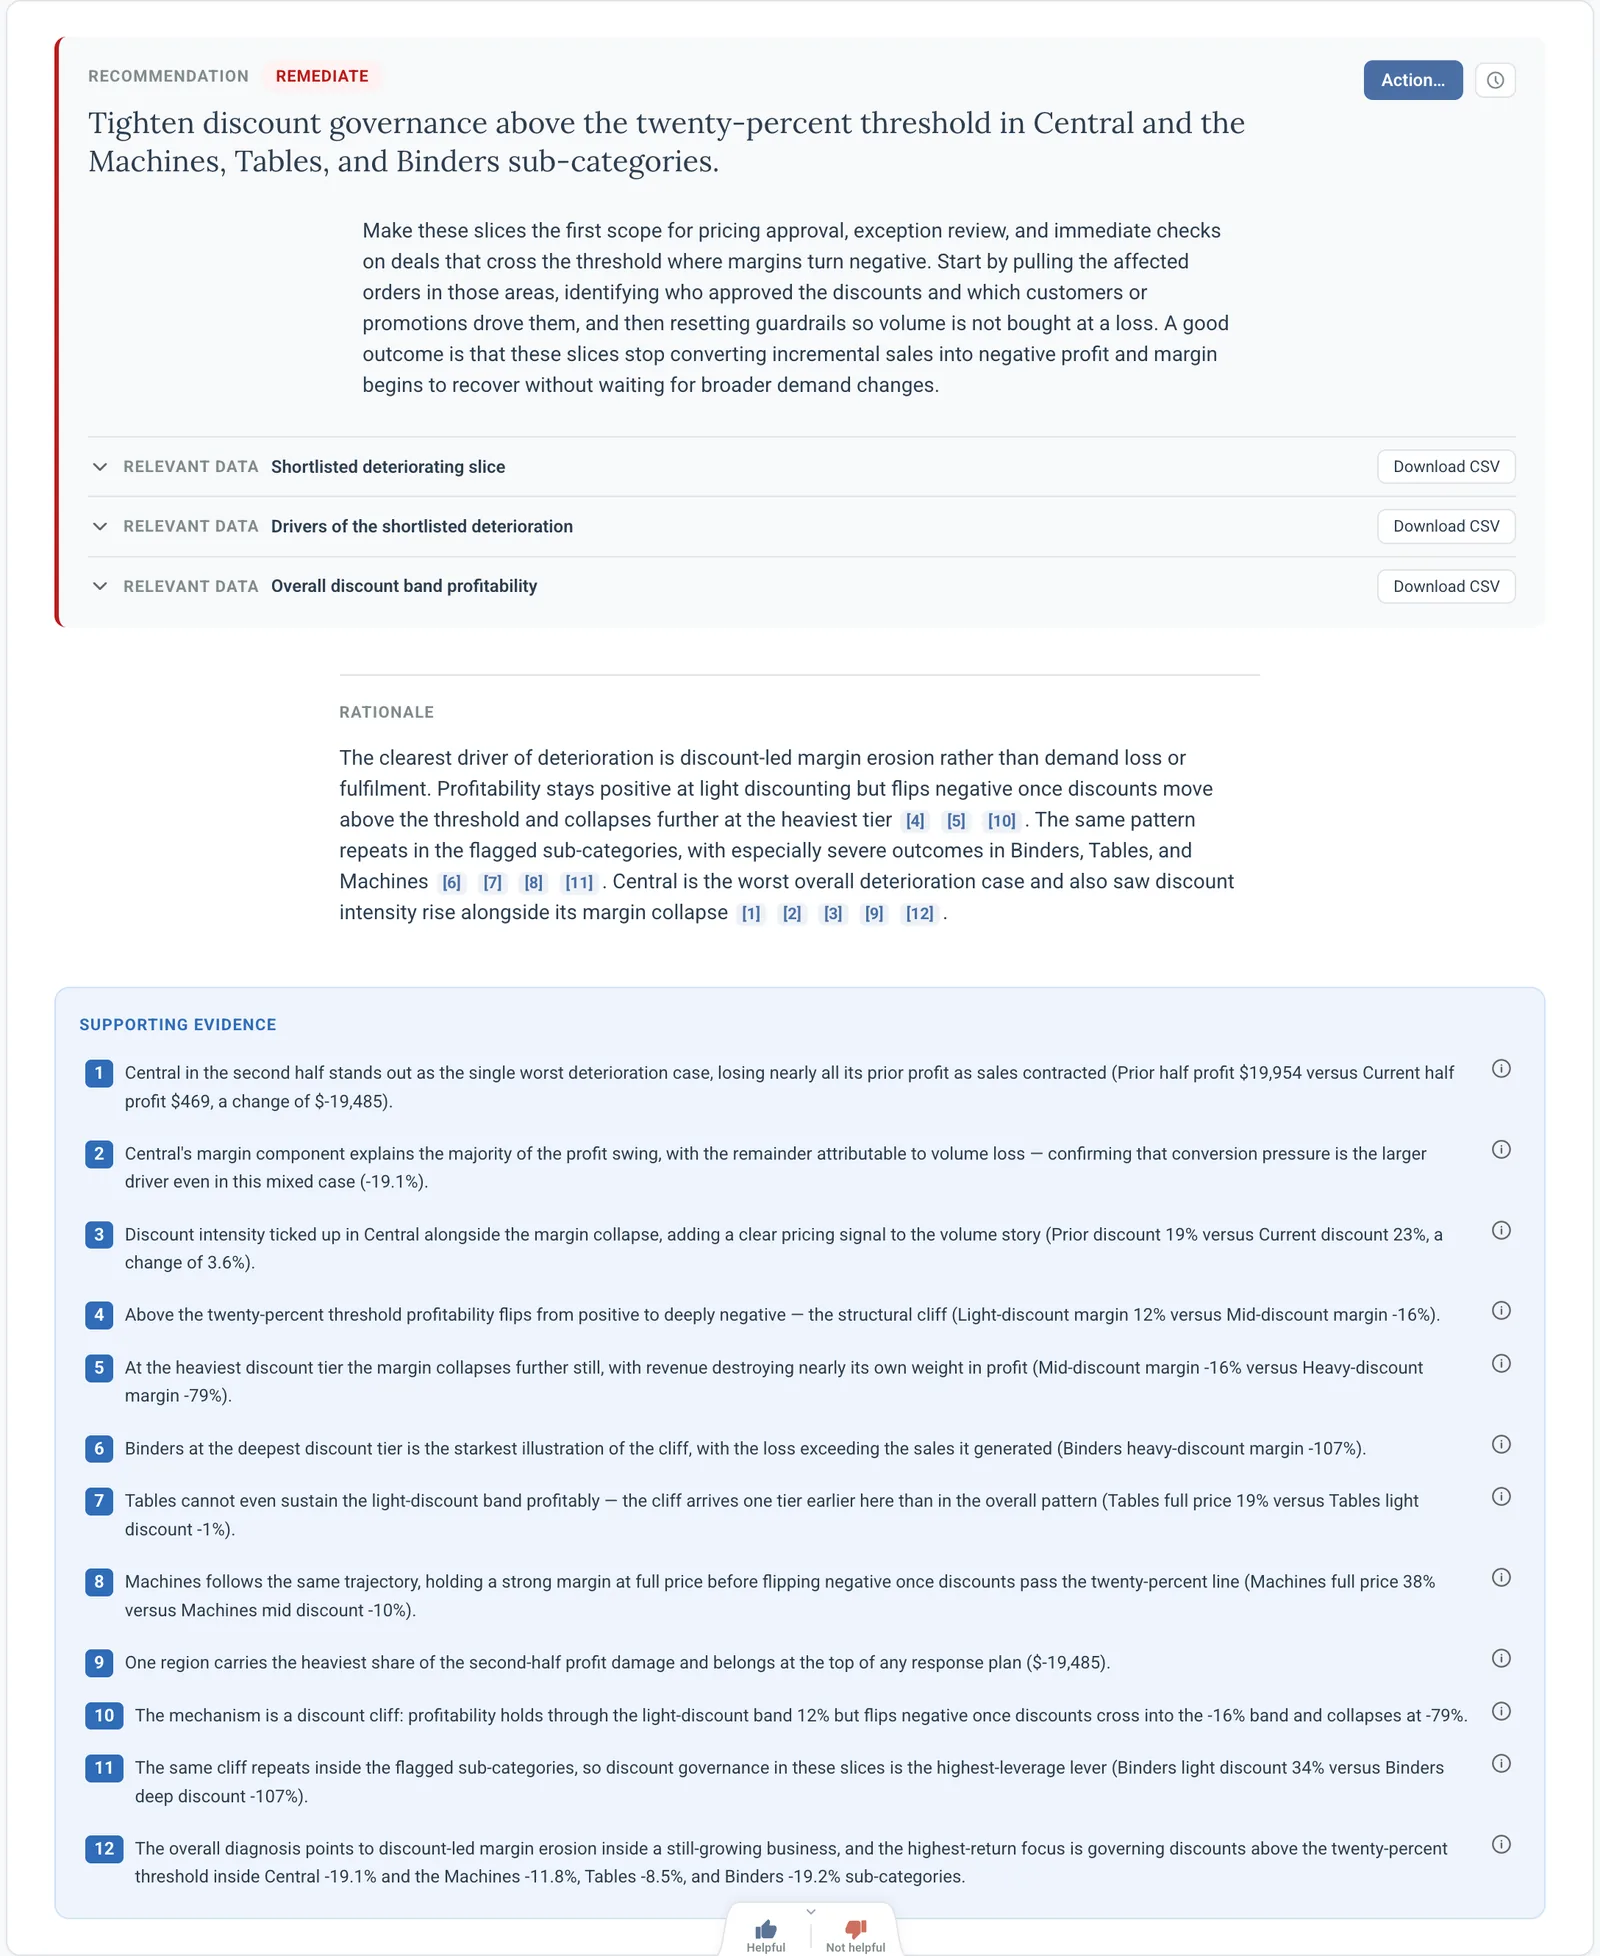
What should we change first?
Every analysis closes with recommendations: what to do, why and the checked facts behind it. Assign them, track them and send them where the work happens.
Protecting your data
Works from the tables you already have
Orders, products, stores, customers and loyalty events, wherever they live. Dactana reads them where they are and never keeps a copy.
 Snowflake
 BigQuery
 Databricks
 PostgreSQL
 ClickHouseSQL ServerFiles and spreadsheets
Bring a trading question
A full demo takes about half an hour. We will run your question live on retail data.
Book a demo