
Telematics and fleet
Built for the questions
a fleet asks.
Trips, fuel, driver behaviour, maps and device configuration, each answered with a component made for fleets and each figure checked before you see it. Pick a question.
Fuel explorer
Where the fuel is going
Cost, economy and idling for the period and for the week, then the same figures for every driver and every vehicle.
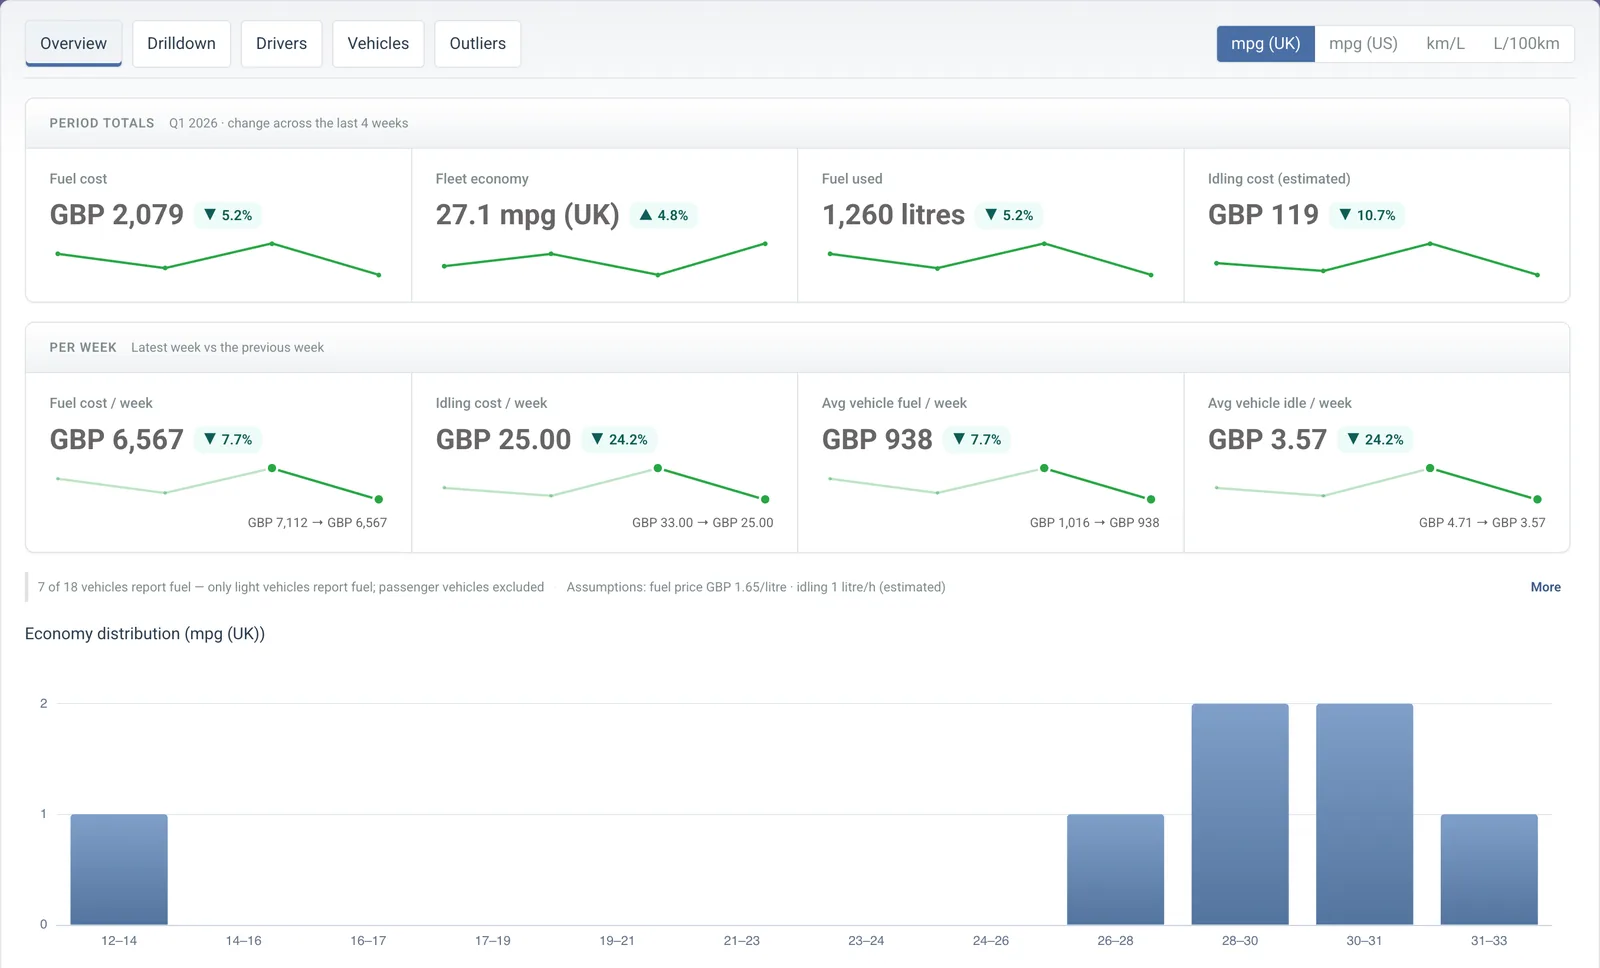
Every vehicle, every driver
Switch between mpg, km per litre and litres per 100 km for a mixed fleet. Sort by economy or by cost, and the outliers are already highlighted, so the conversation starts with the right vehicle.
- Unit switching for fleets that think in more than one measure
- Idling cost estimated per vehicle and per week
- Outliers flagged against the fleet norm, not a fixed rule
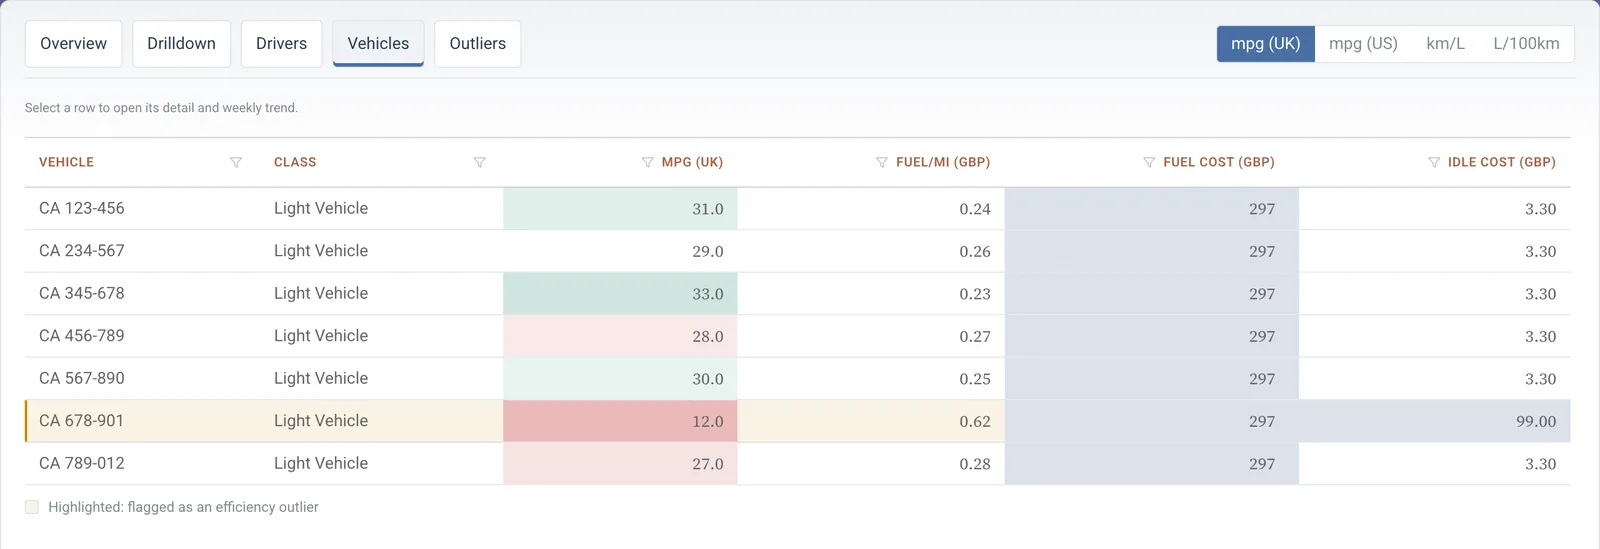
Fleet exceptions
Who needs attention this week
One board for speeding, harsh driving, idling and over-long trips. See who is over policy, who is an outlier against their peers and how each behaviour is trending.
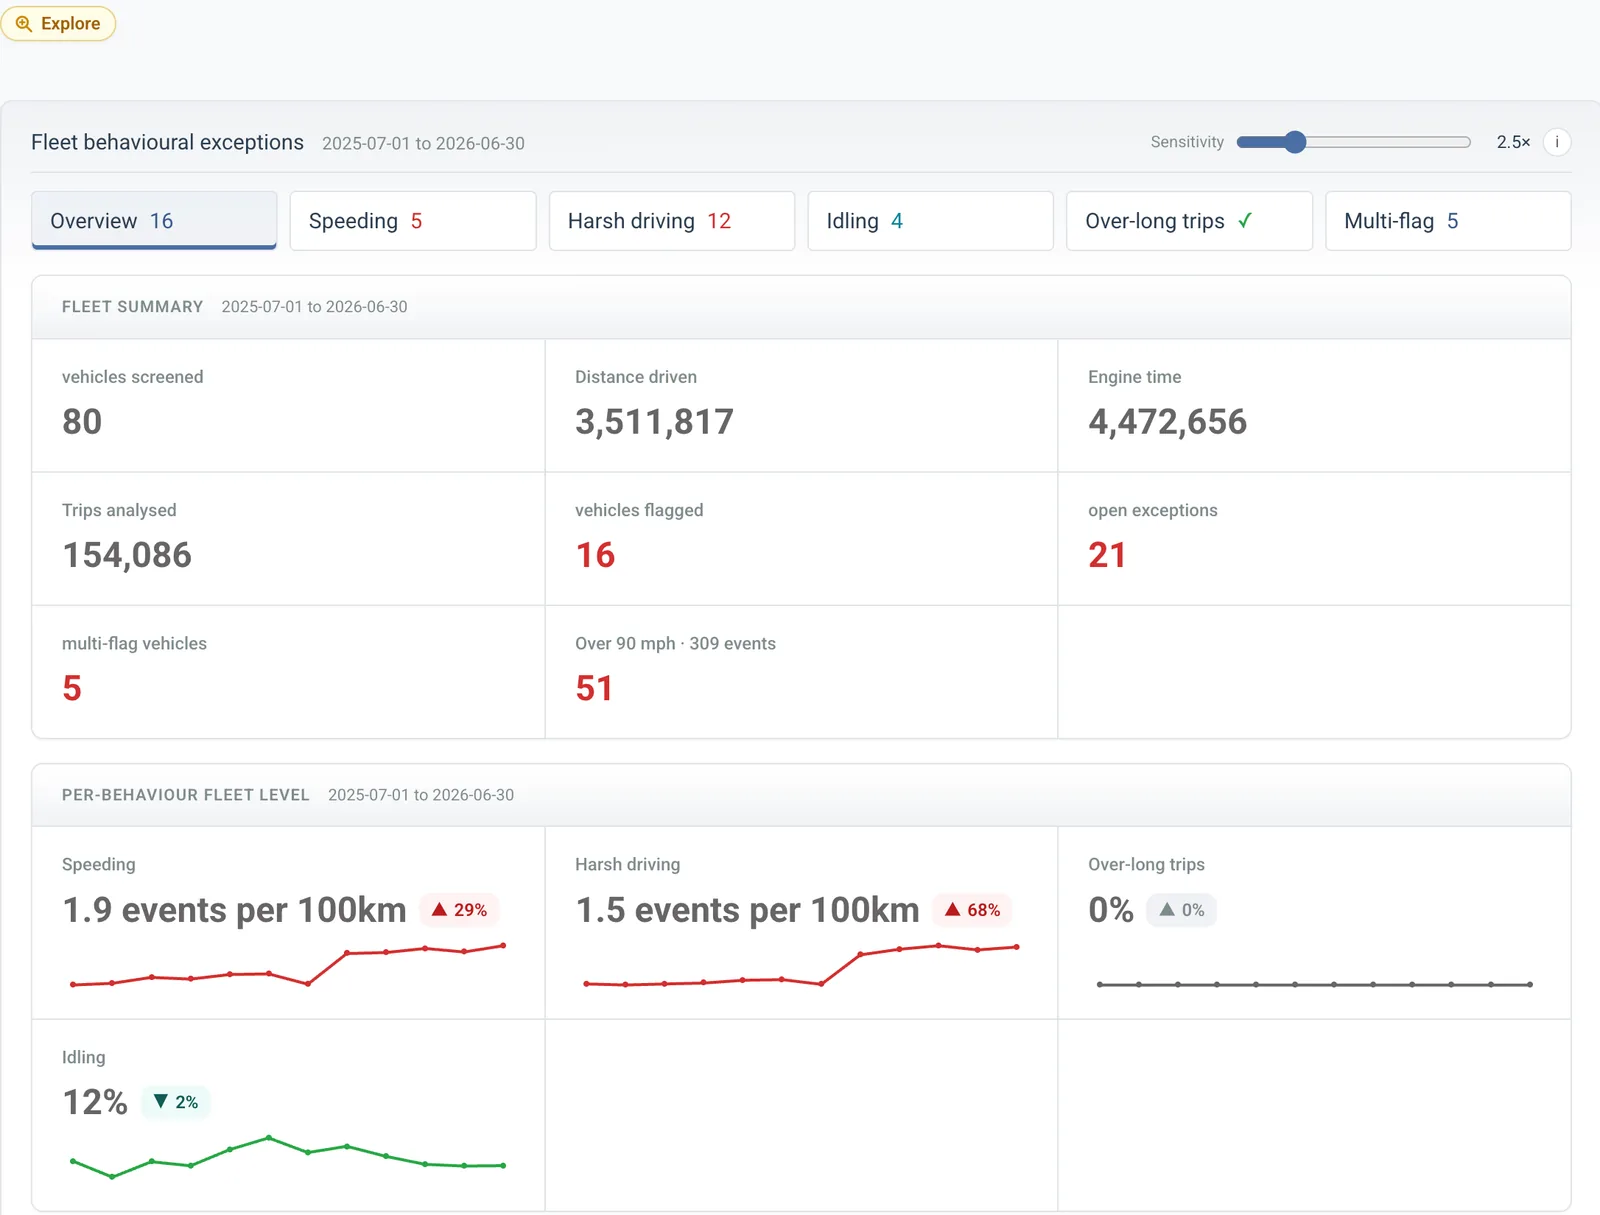
Policy and peers
A vehicle can be inside policy and still be far from its peers. The board shows both, so a quiet outlier is not missed.
Sensitivity you control
Tighten or loosen the outlier threshold and every count on the board updates in place.
From flag to action
Each flagged vehicle can be explored, assigned to someone or sent to the system where the work happens.
Trip list
Every trip, every shift
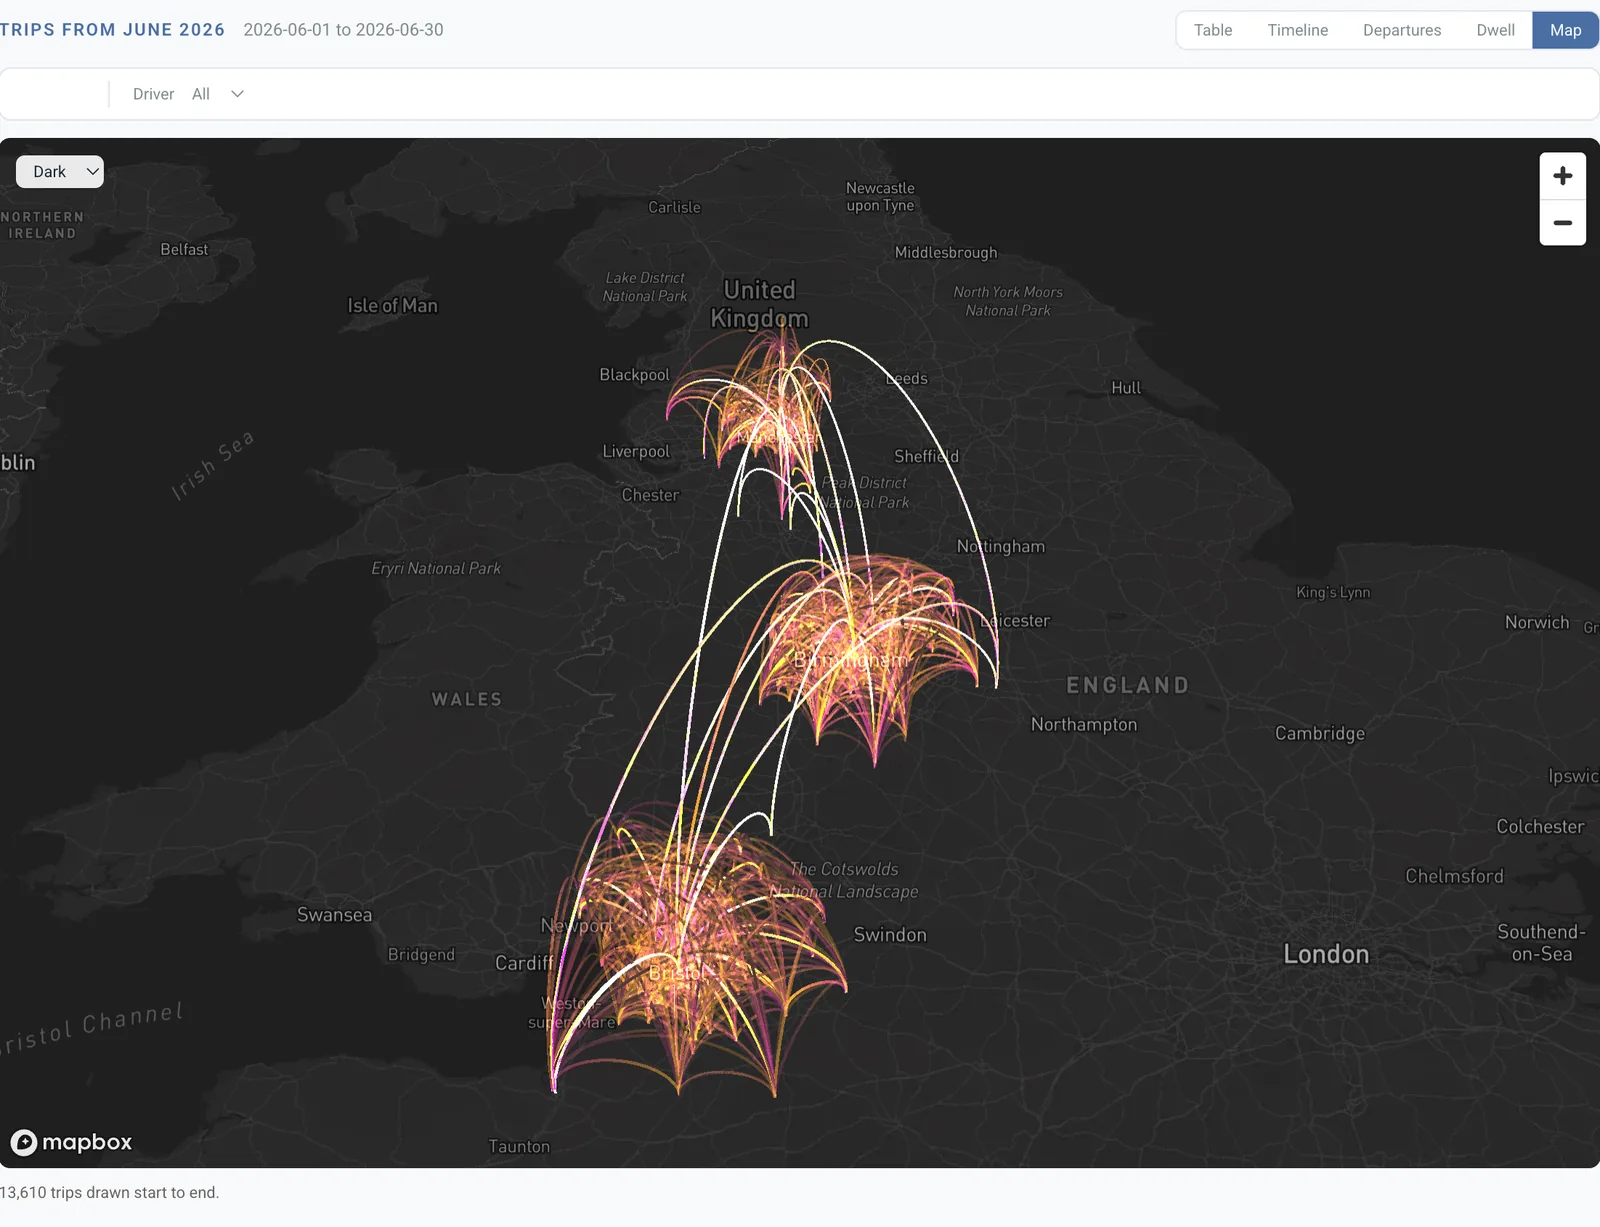
The working day laid out by vehicle or by driver: a sortable table, a timeline, departures, dwell time and a map, all from the same trips.
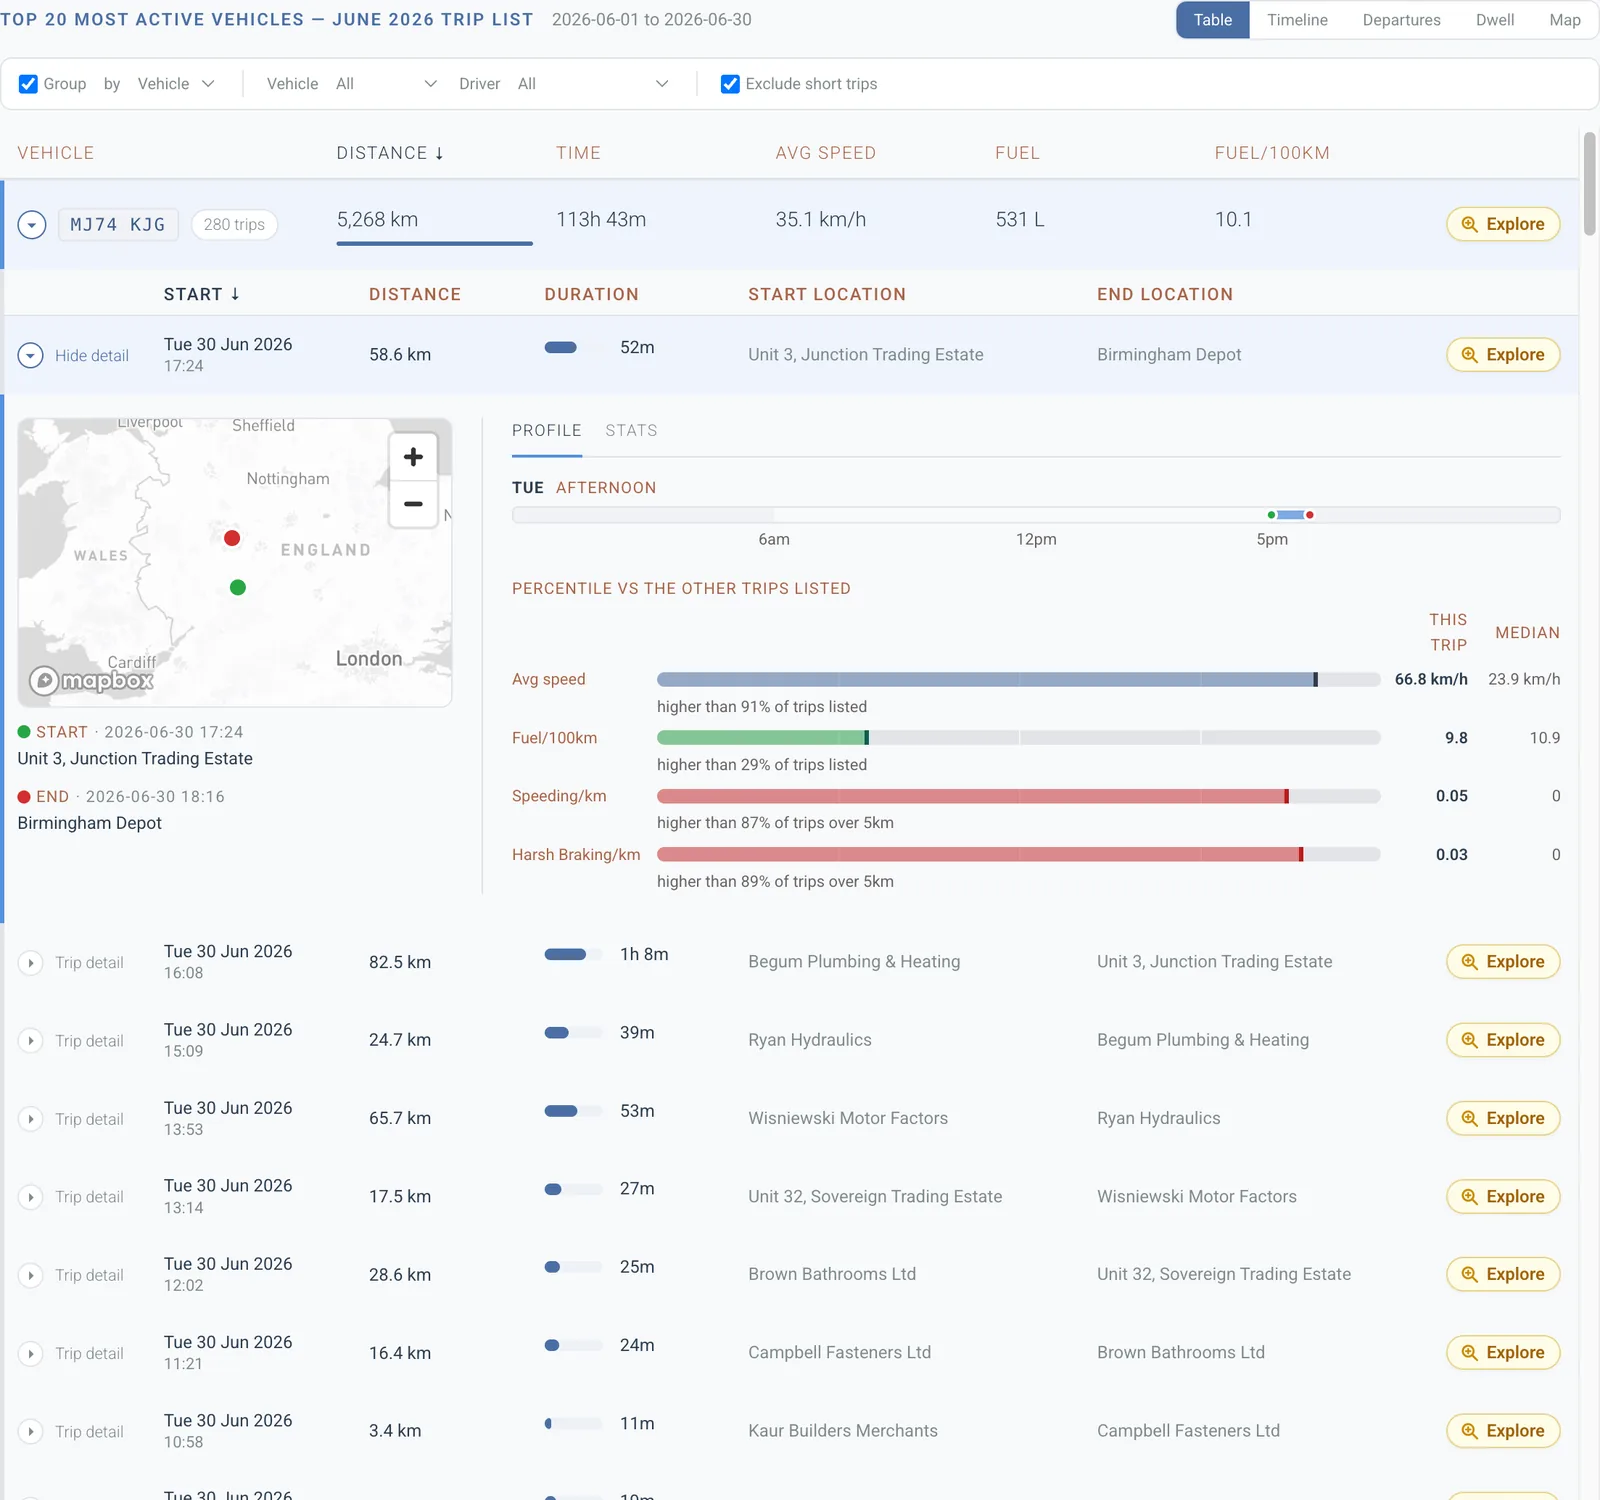
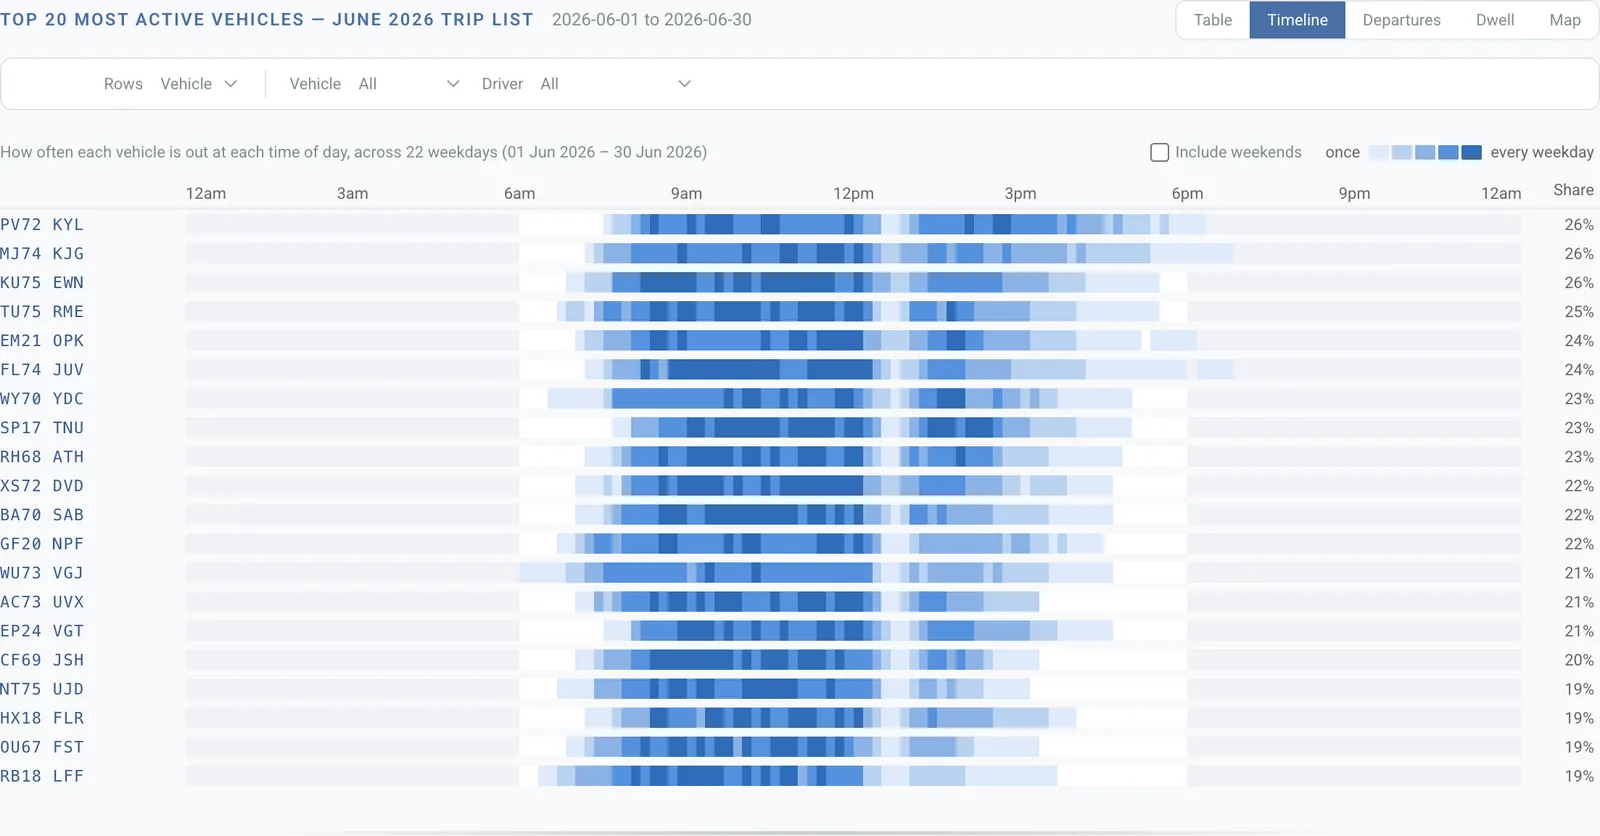
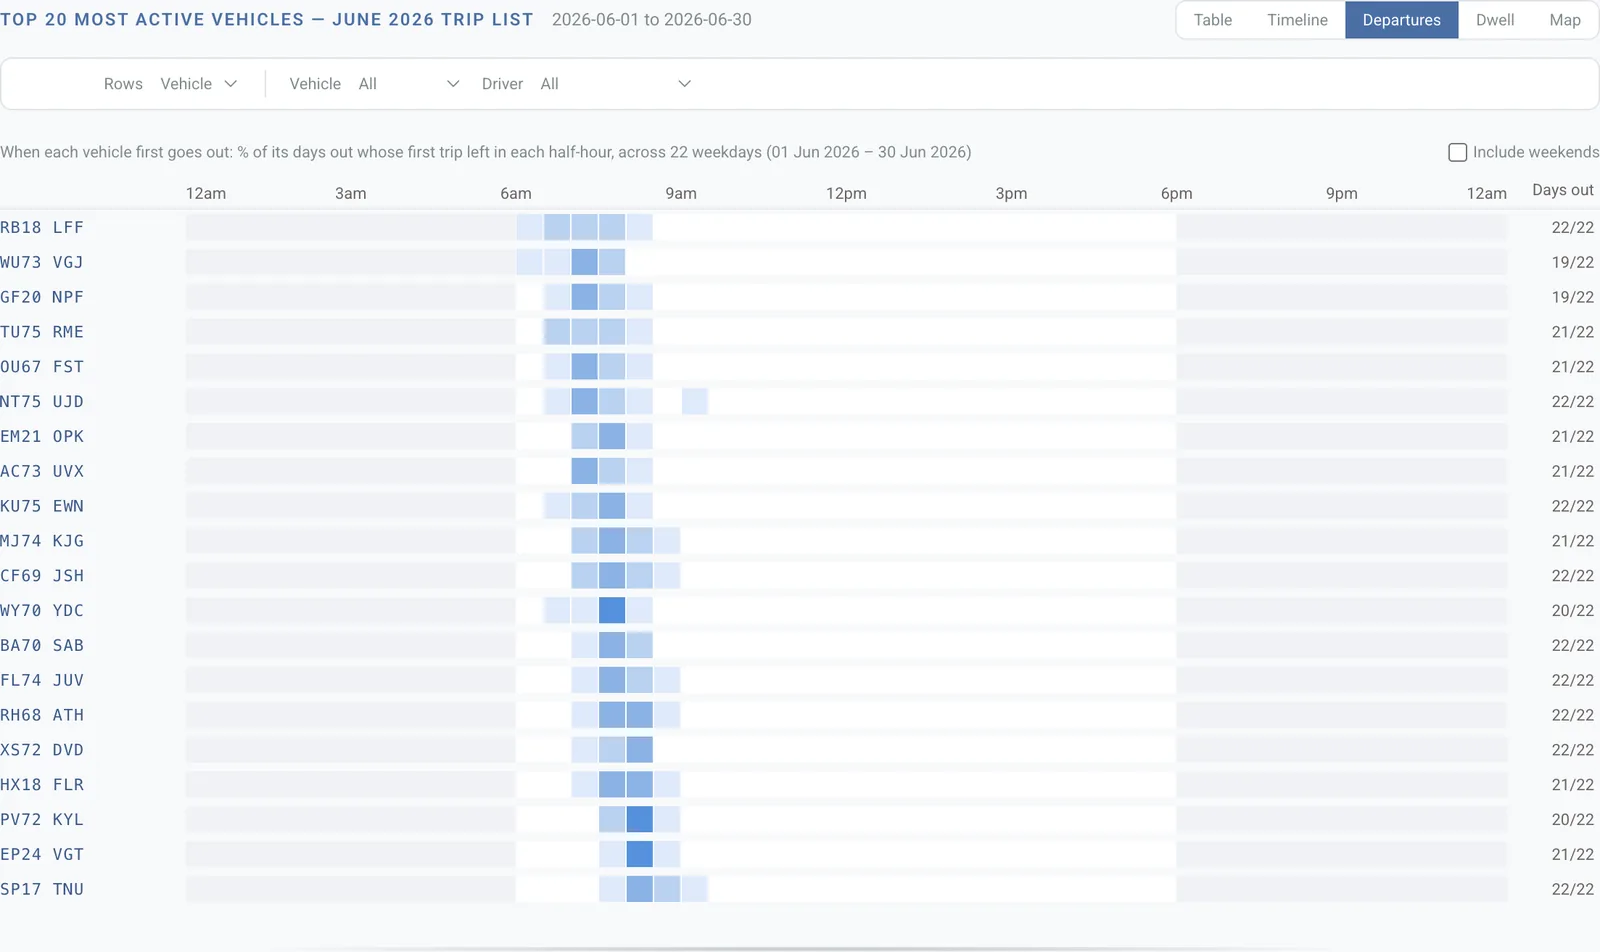
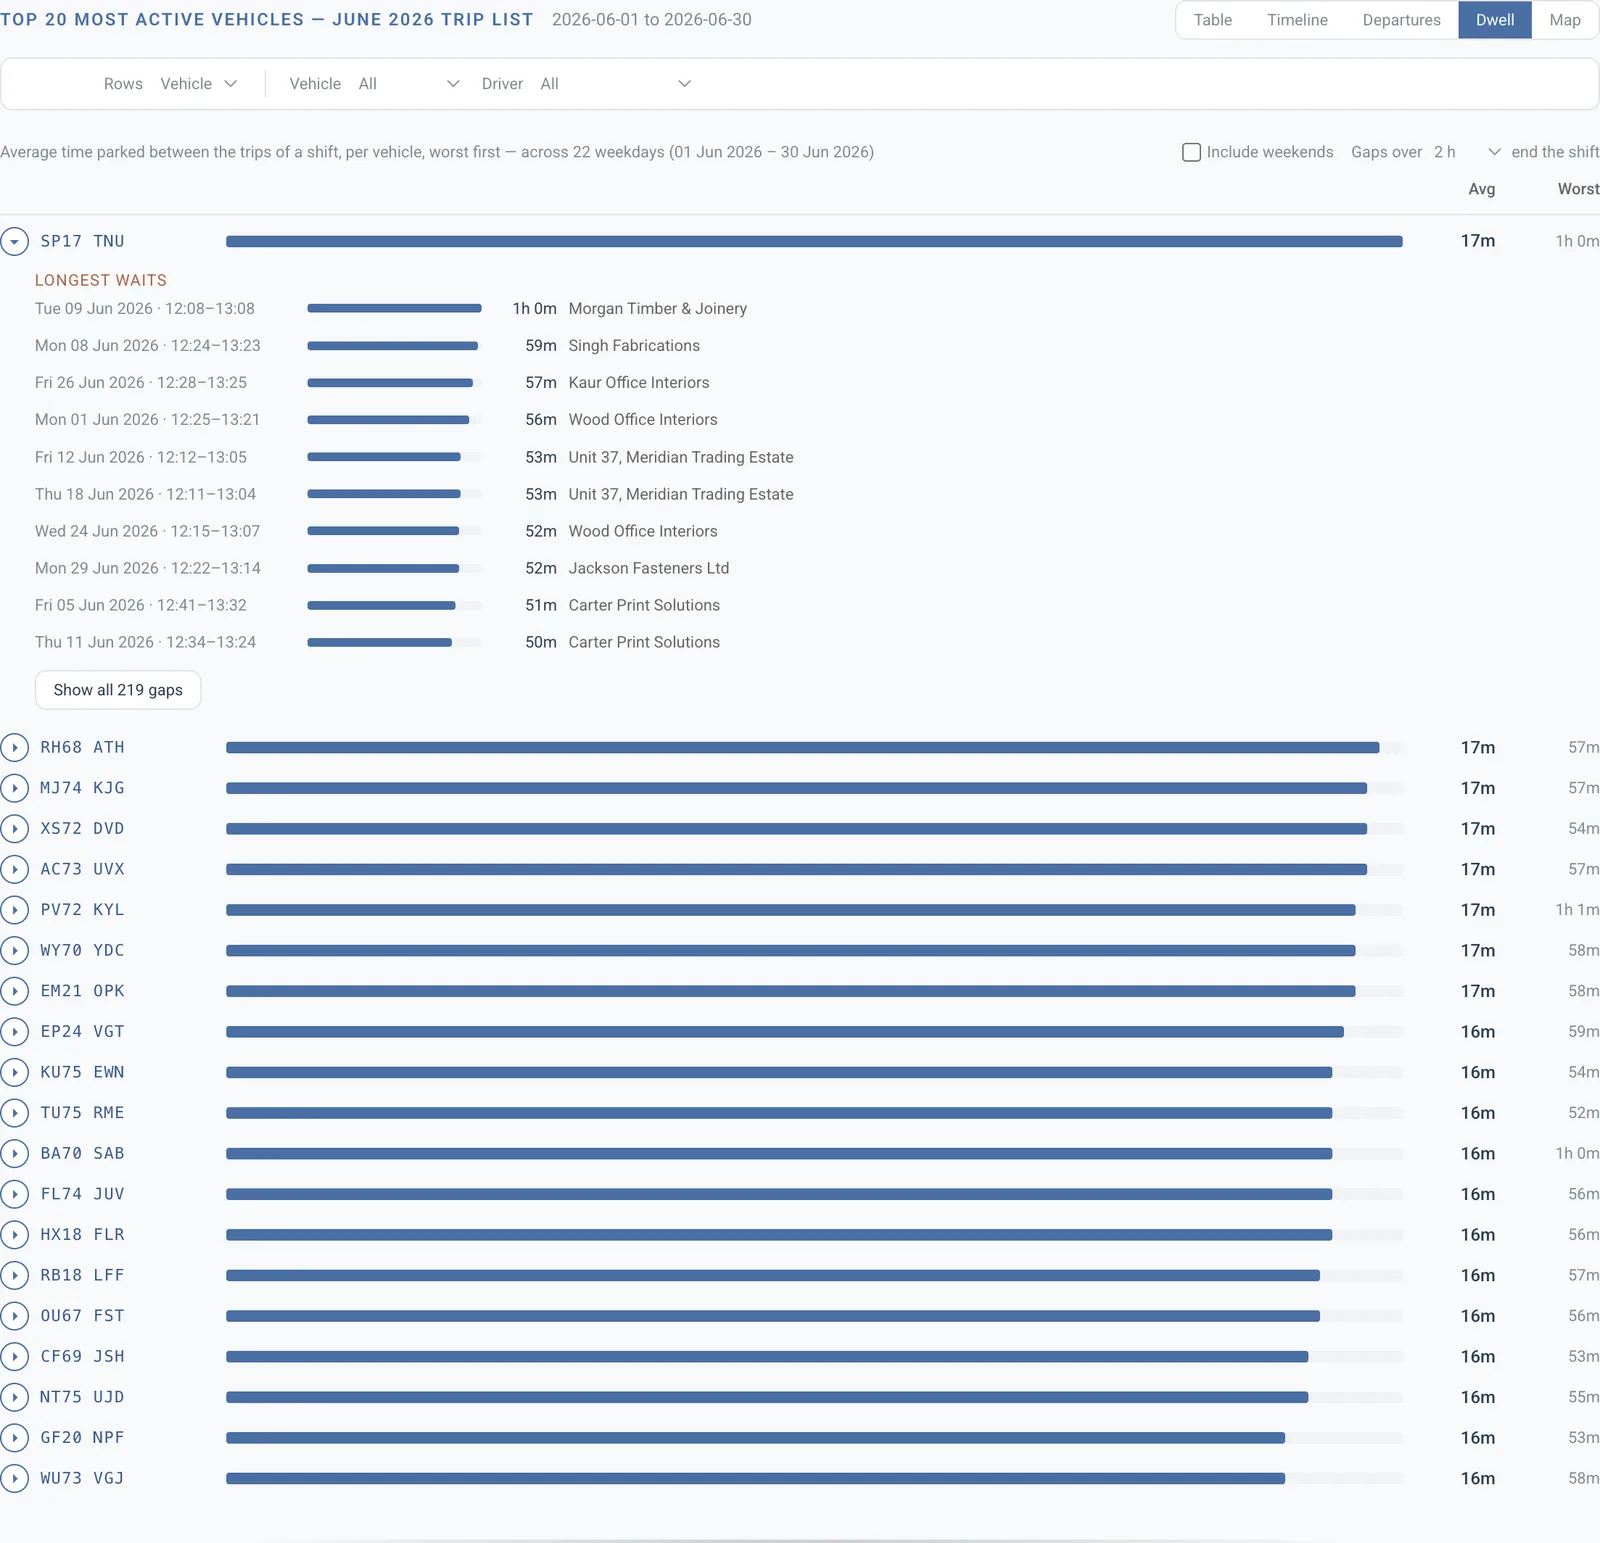
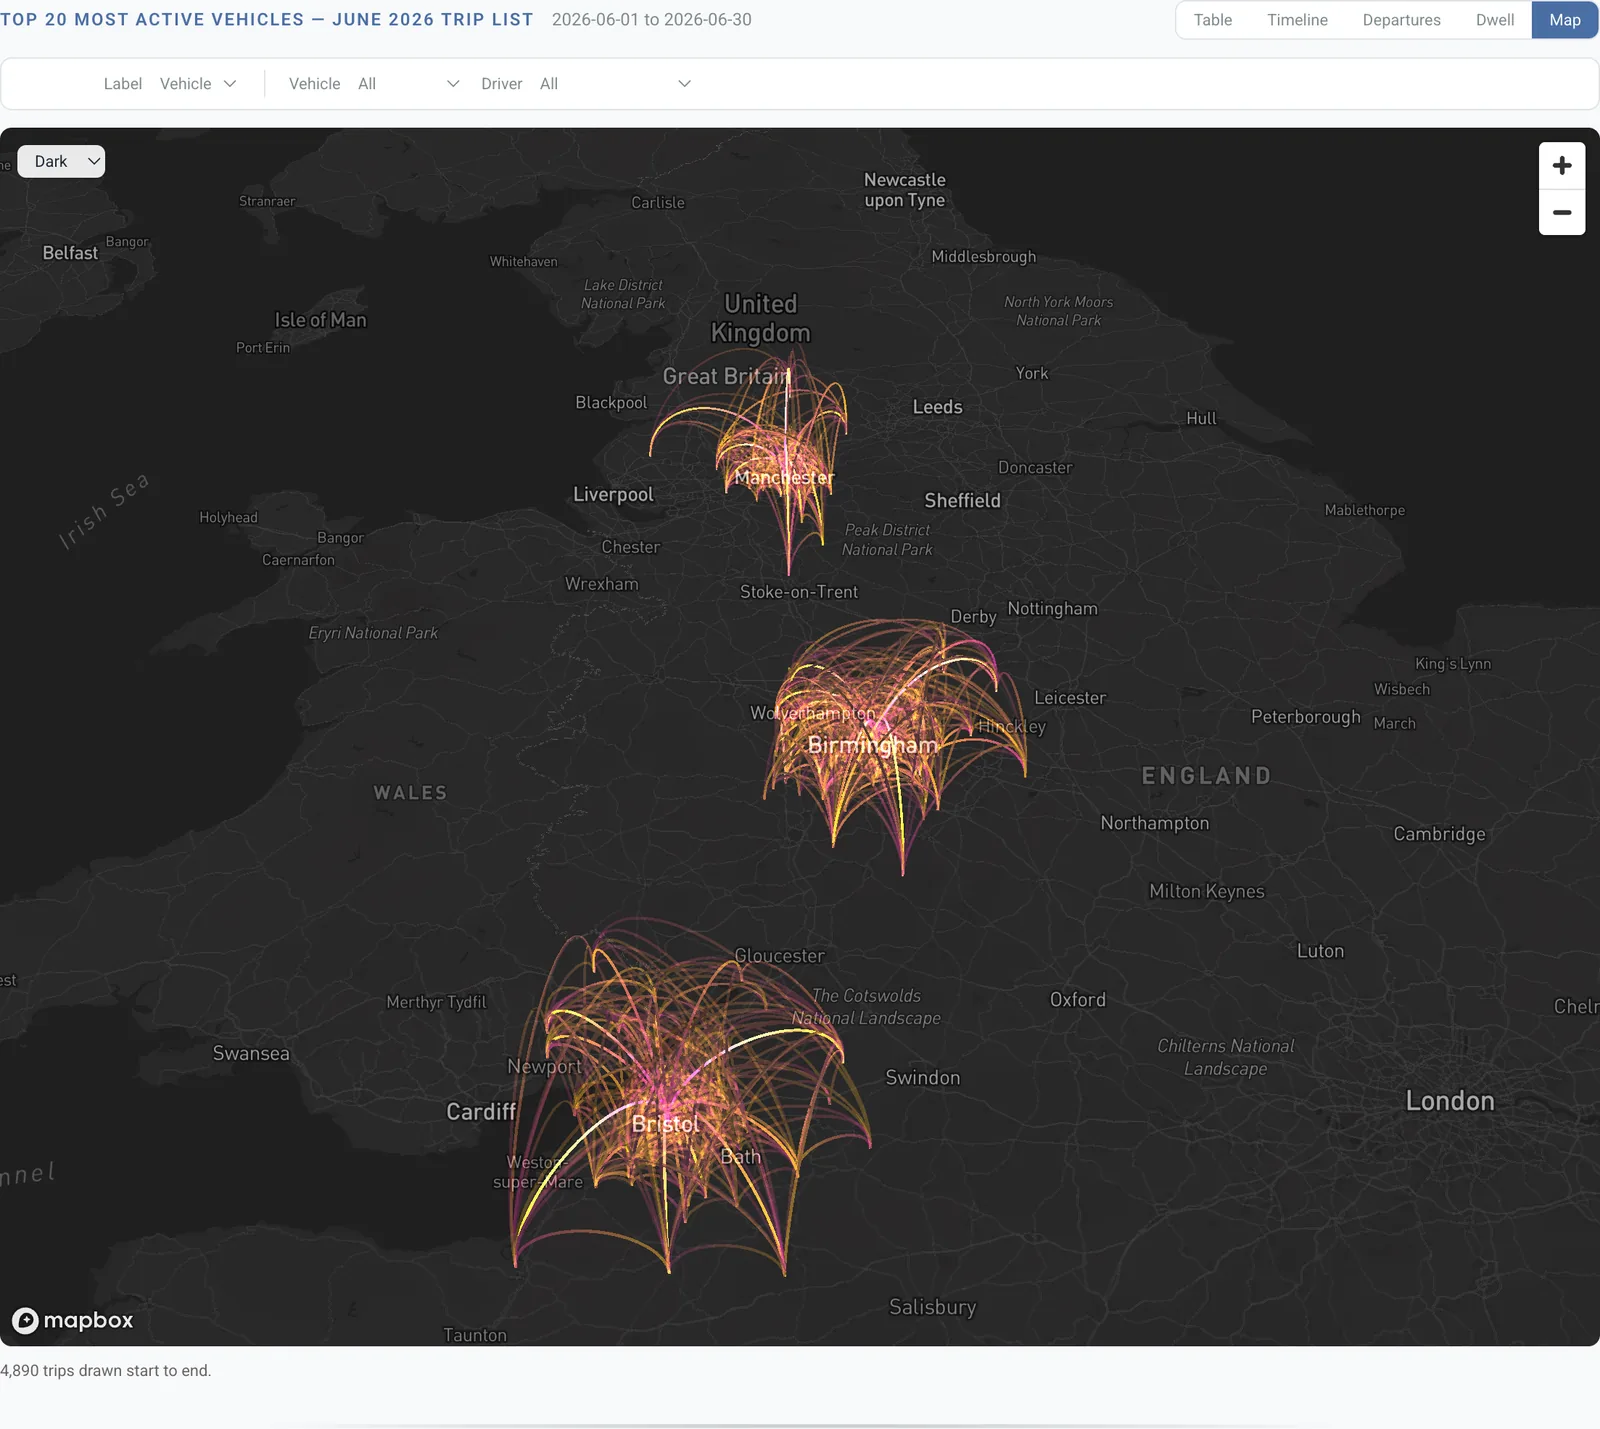
Read the shift, not just the total
Departure and dwell views turn thousands of trips into a pattern you can read in seconds: which vehicles leave before six, which sit parked for an hour between jobs and which days are missing altogether. Group by driver instead and the same month reads as a story about people.
- Weekdays or the whole week, one toggle
- Short trips excluded so depot shuffles do not count
- Every row explorable, straight into a new question
Geo components
See it on the map
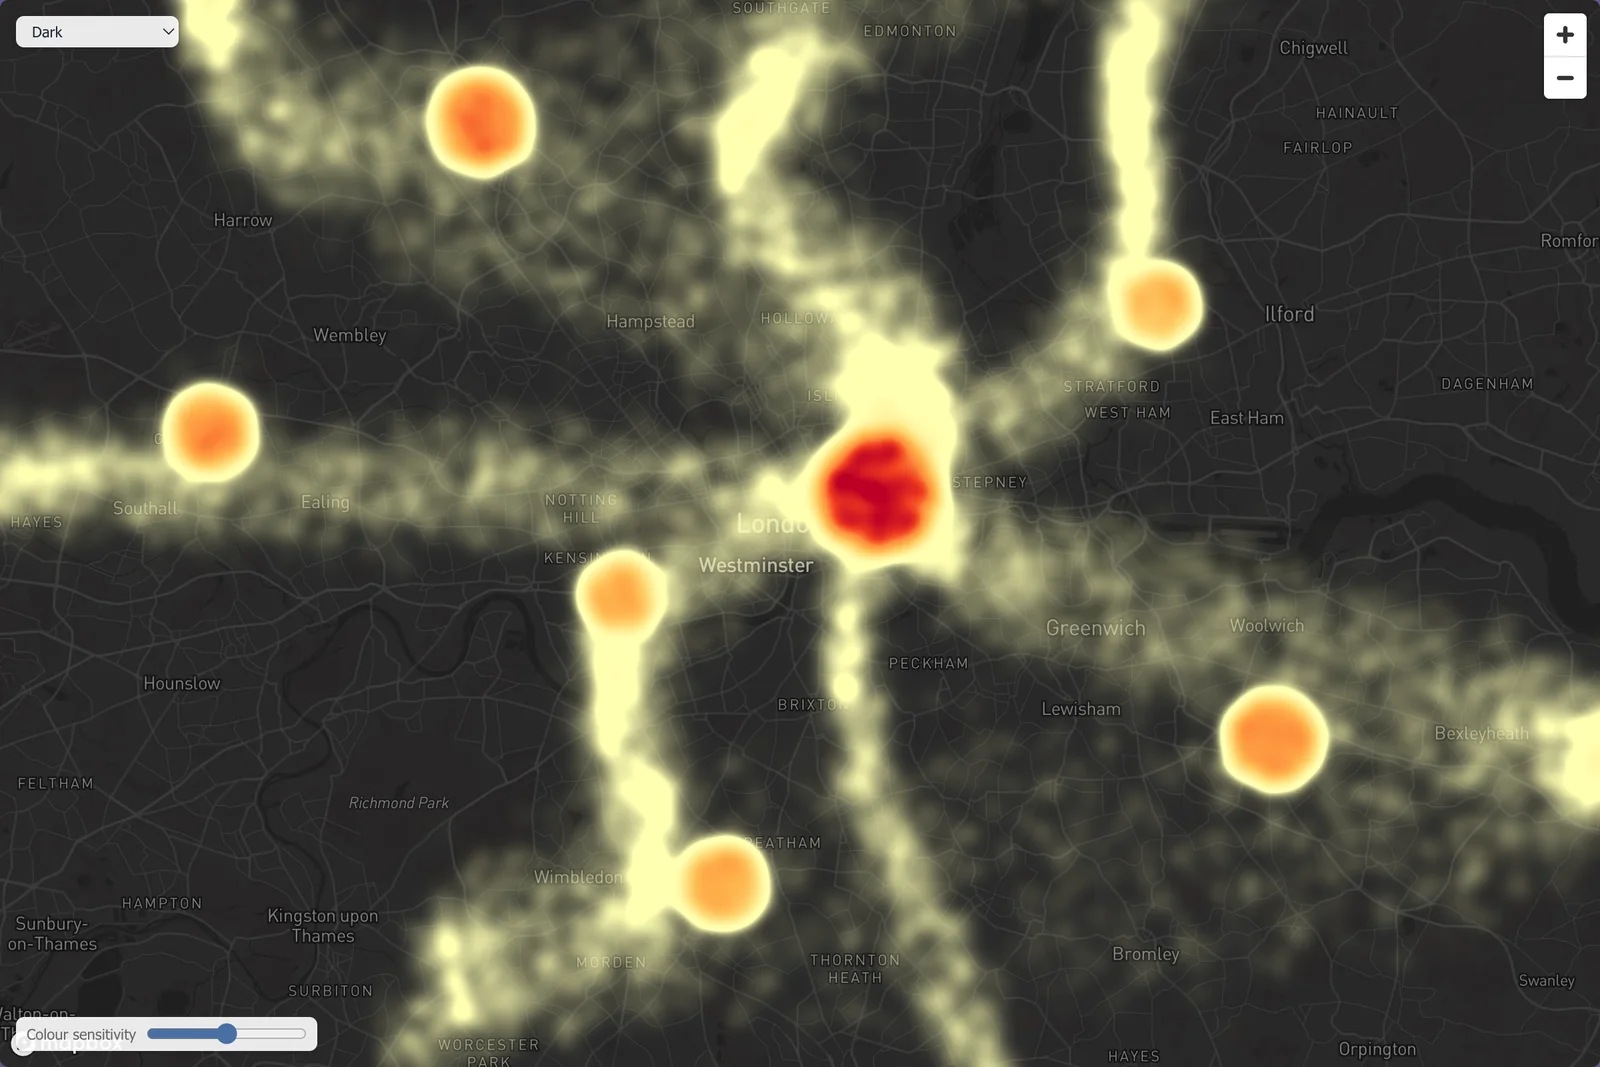
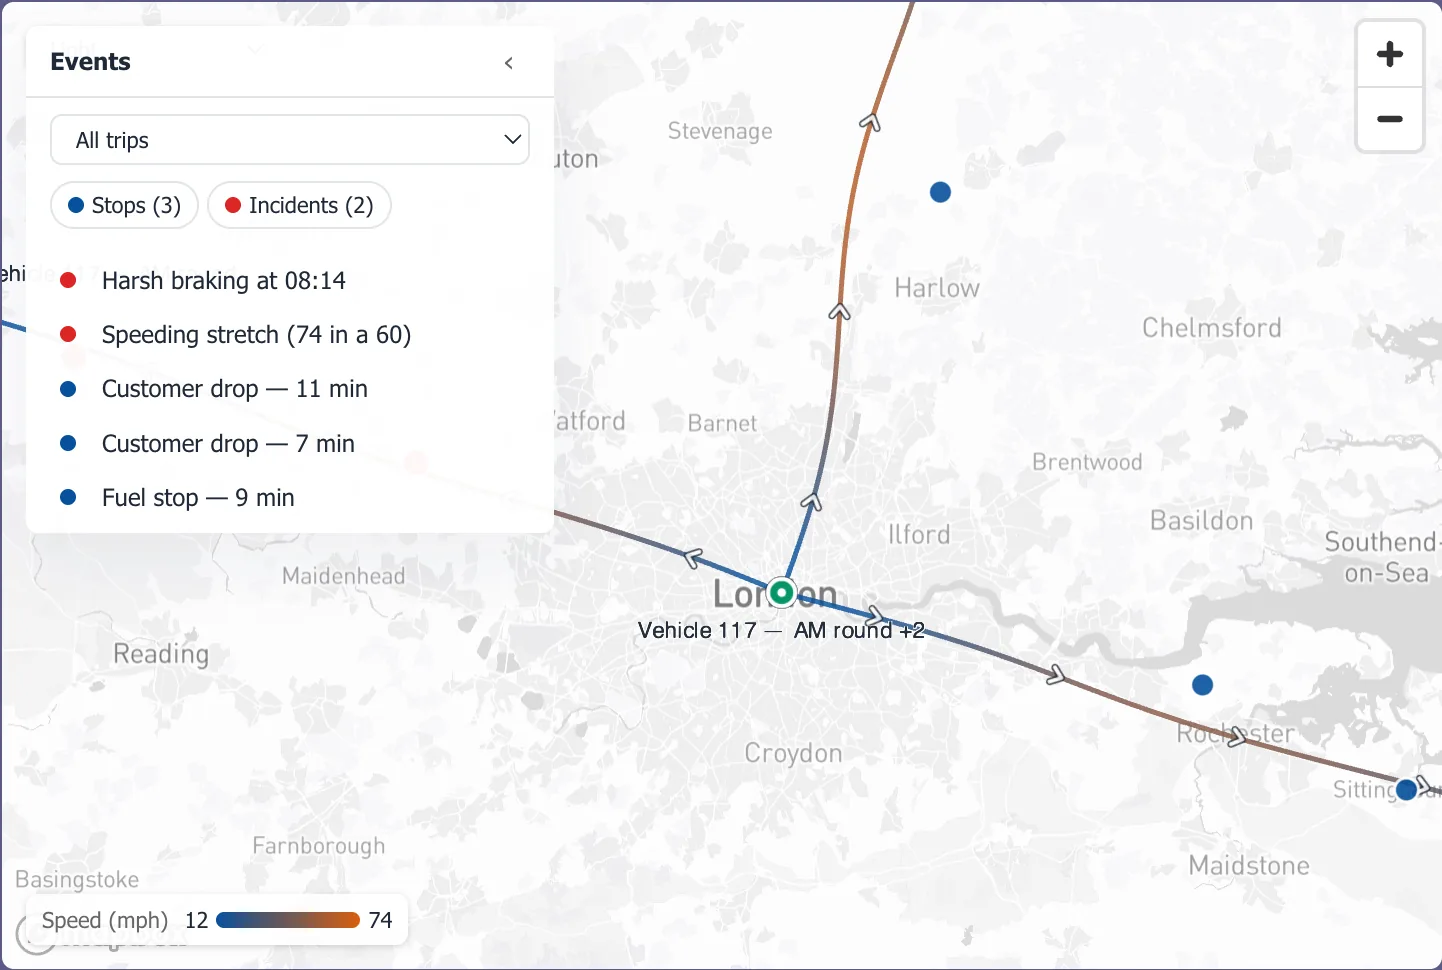
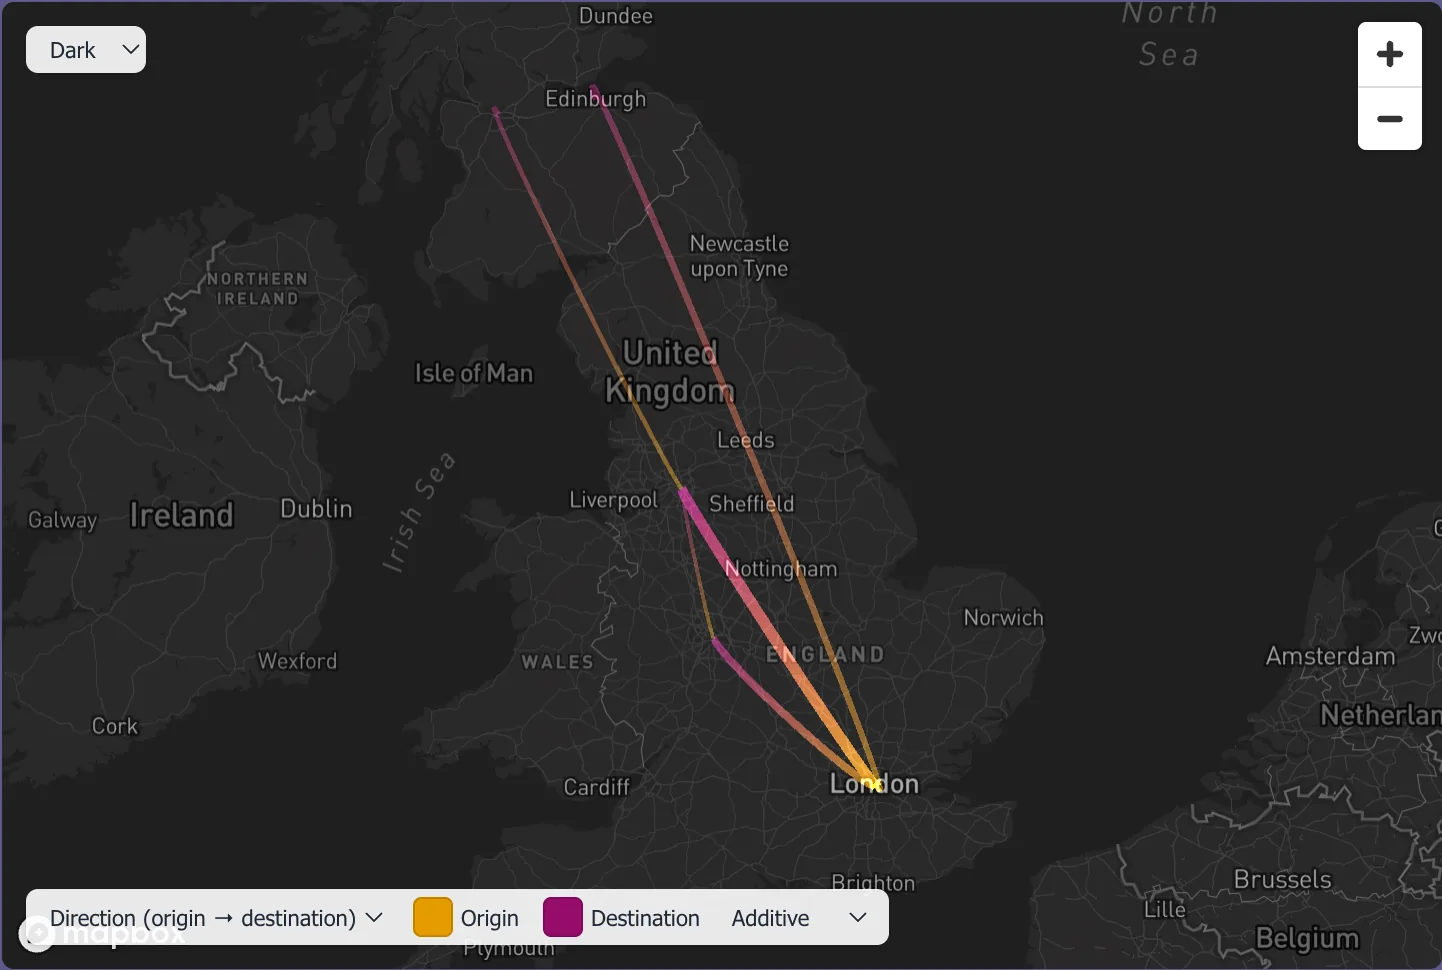
Density, routes and flows on real basemaps. Each map is interactive and each one is tied back to the figures on the slide it sits on.
Configuration explorer
Is every vehicle on the right configuration?
A real estate has tens of configurations across several device models, vehicle types and depots and it never lines up perfectly. Dactana lays the whole estate out and lets you turn it to find the odd ones out.
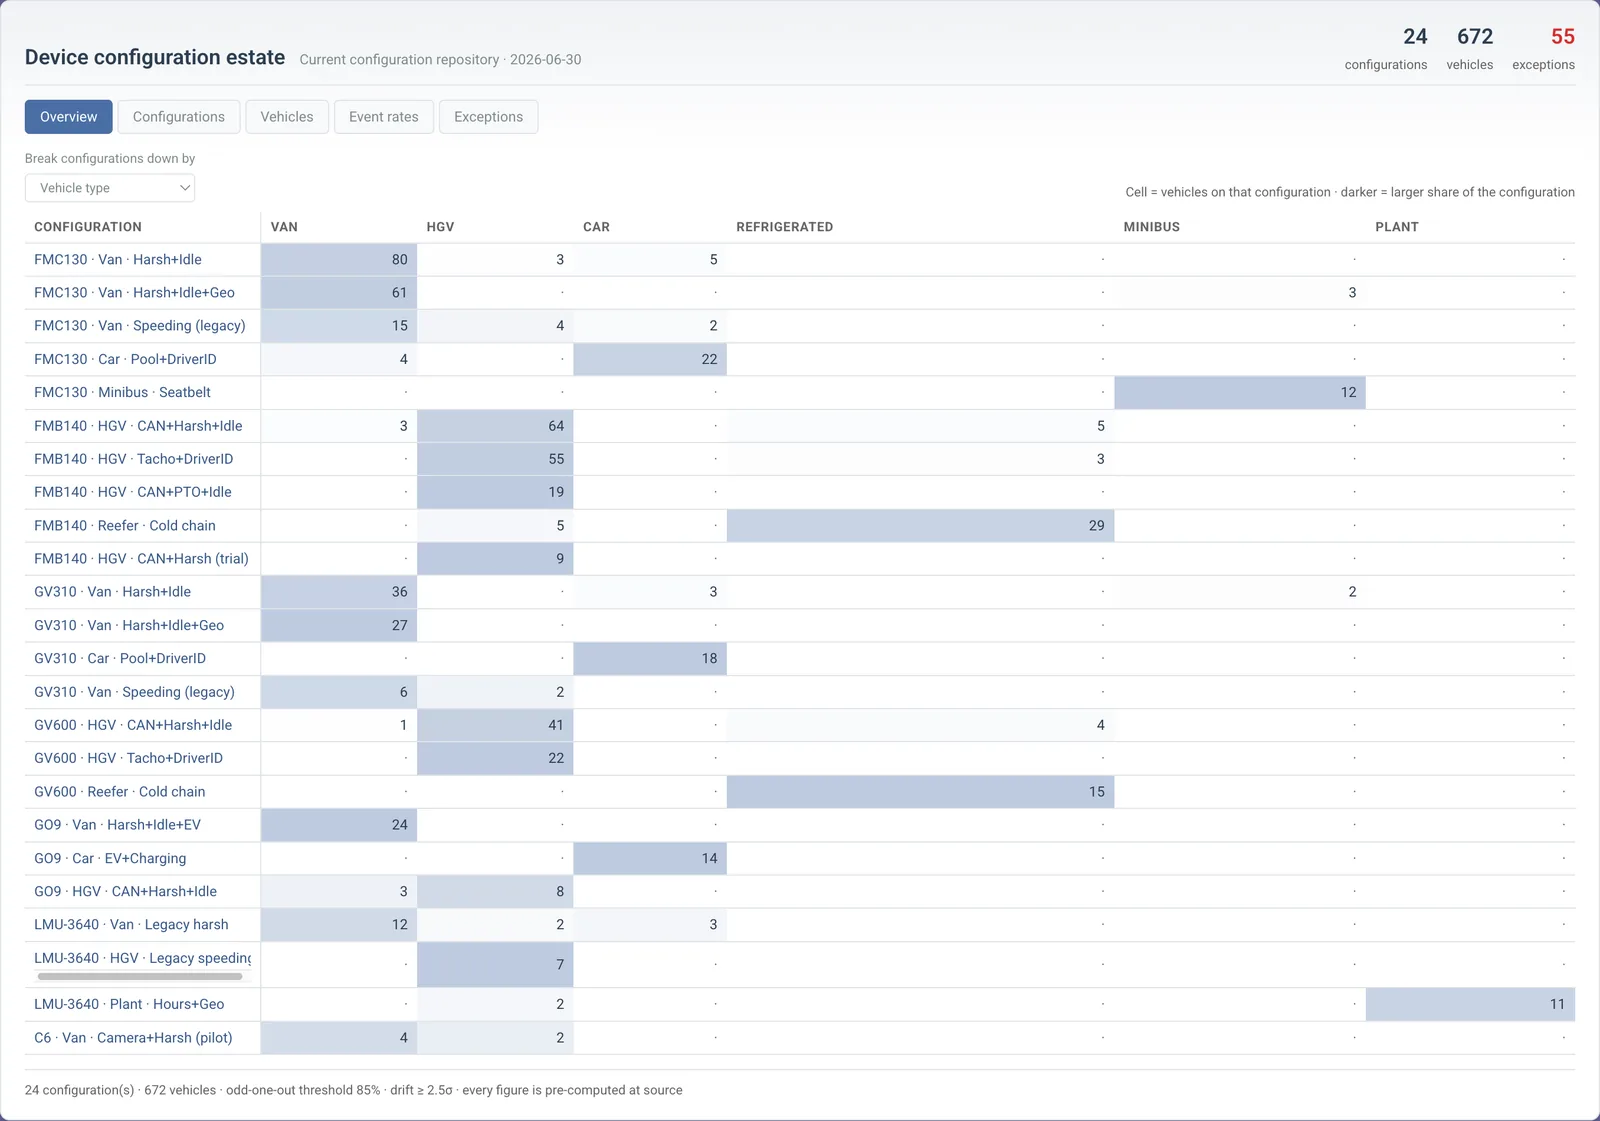
Turn it by device, vehicle type or depot
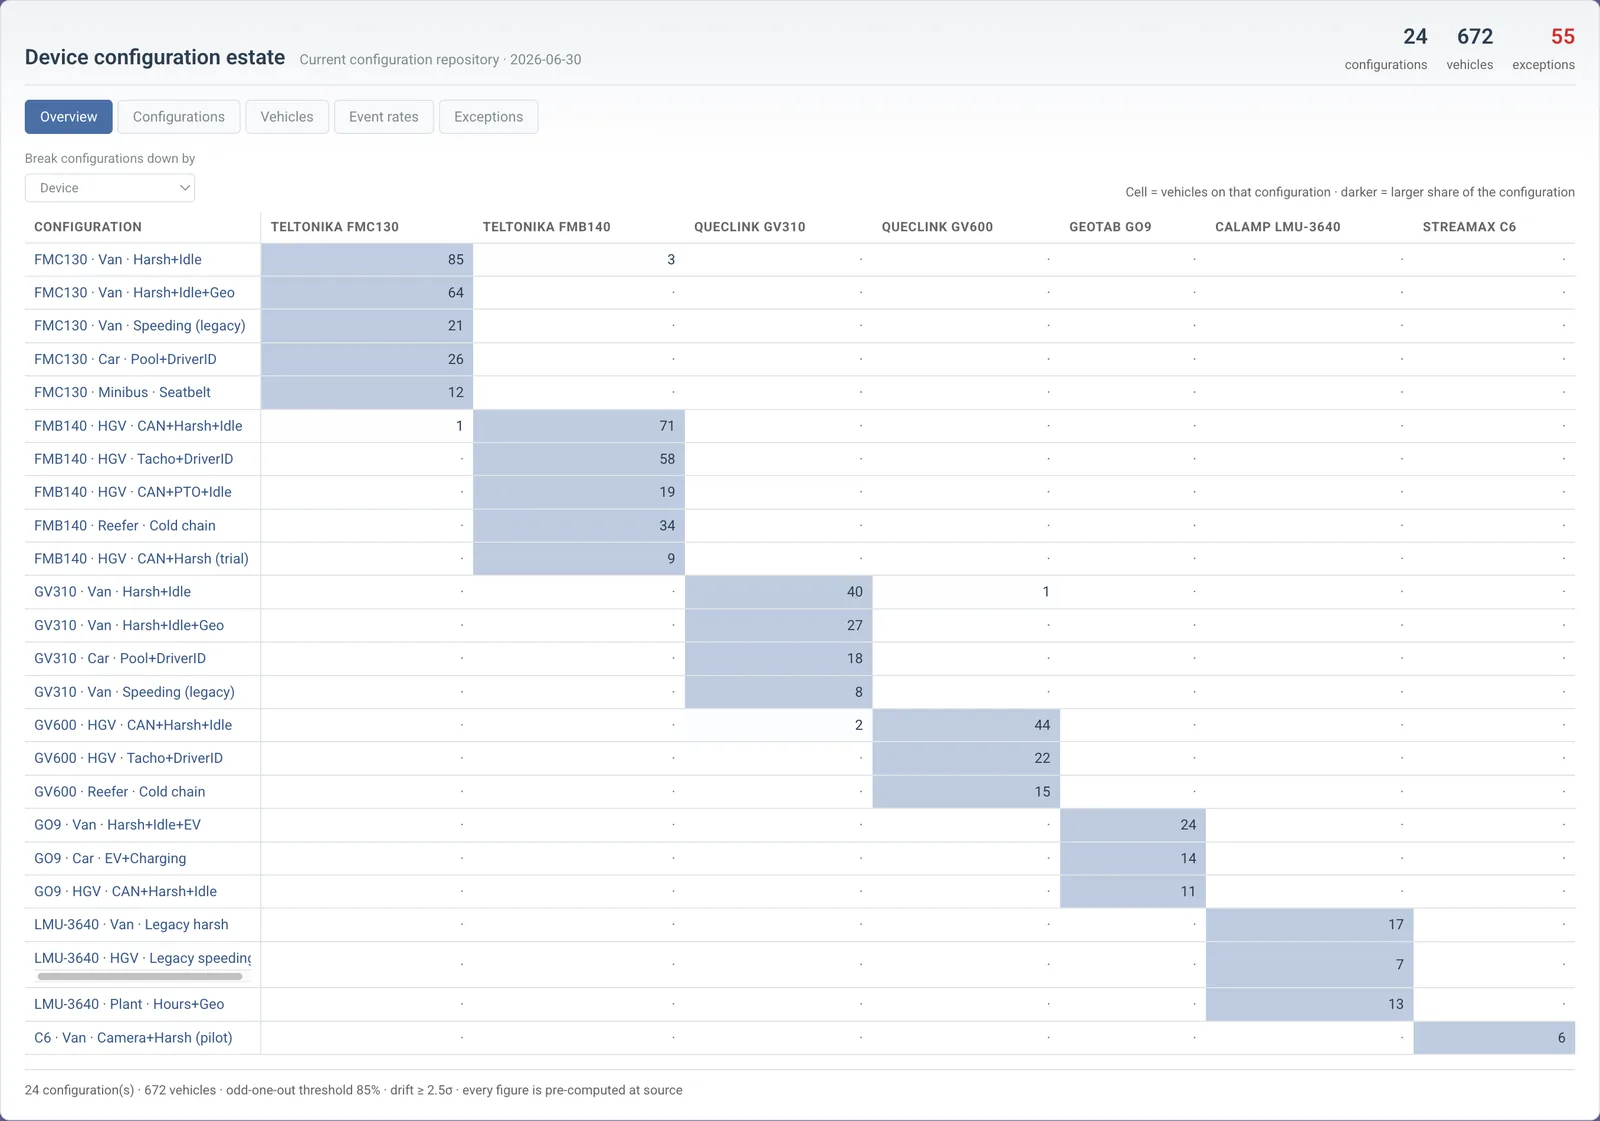
The same landscape broken down by device shows the three FMB140 units sitting on an FMC130 configuration and the GV310 on a GV600 one. Break it down by depot and a configuration that only exists at one site stands out just as fast.
- One row per configuration, named for its device, vehicle type and features
- Any dimension as the columns, darker cells for a larger share
- Mixed configurations read at a glance, without a threshold
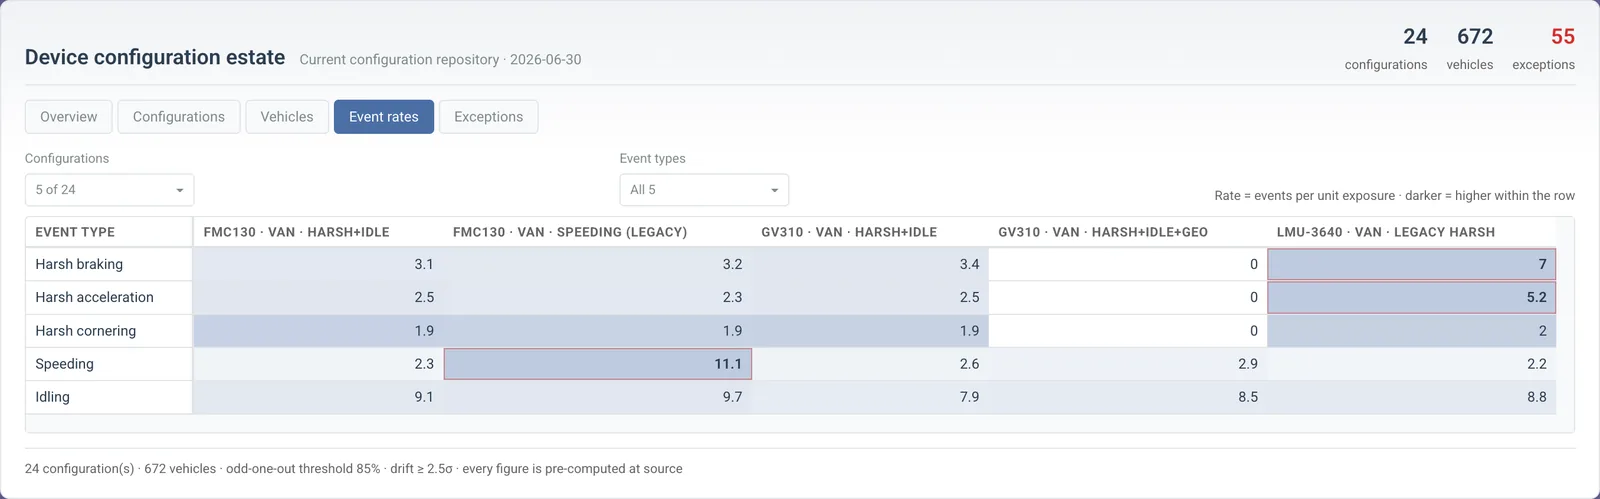
Does the configuration do what its name says?
Event rates per configuration show whether the settings are actually in force. Here a configuration named for harsh events reports none at all, while two legacy speeding configurations fire at four times the rate of their neighbours.
- Rates per configuration and event type, shaded within the row
- High outliers flagged against the other configurations
- Silent configurations show as a column of zeros
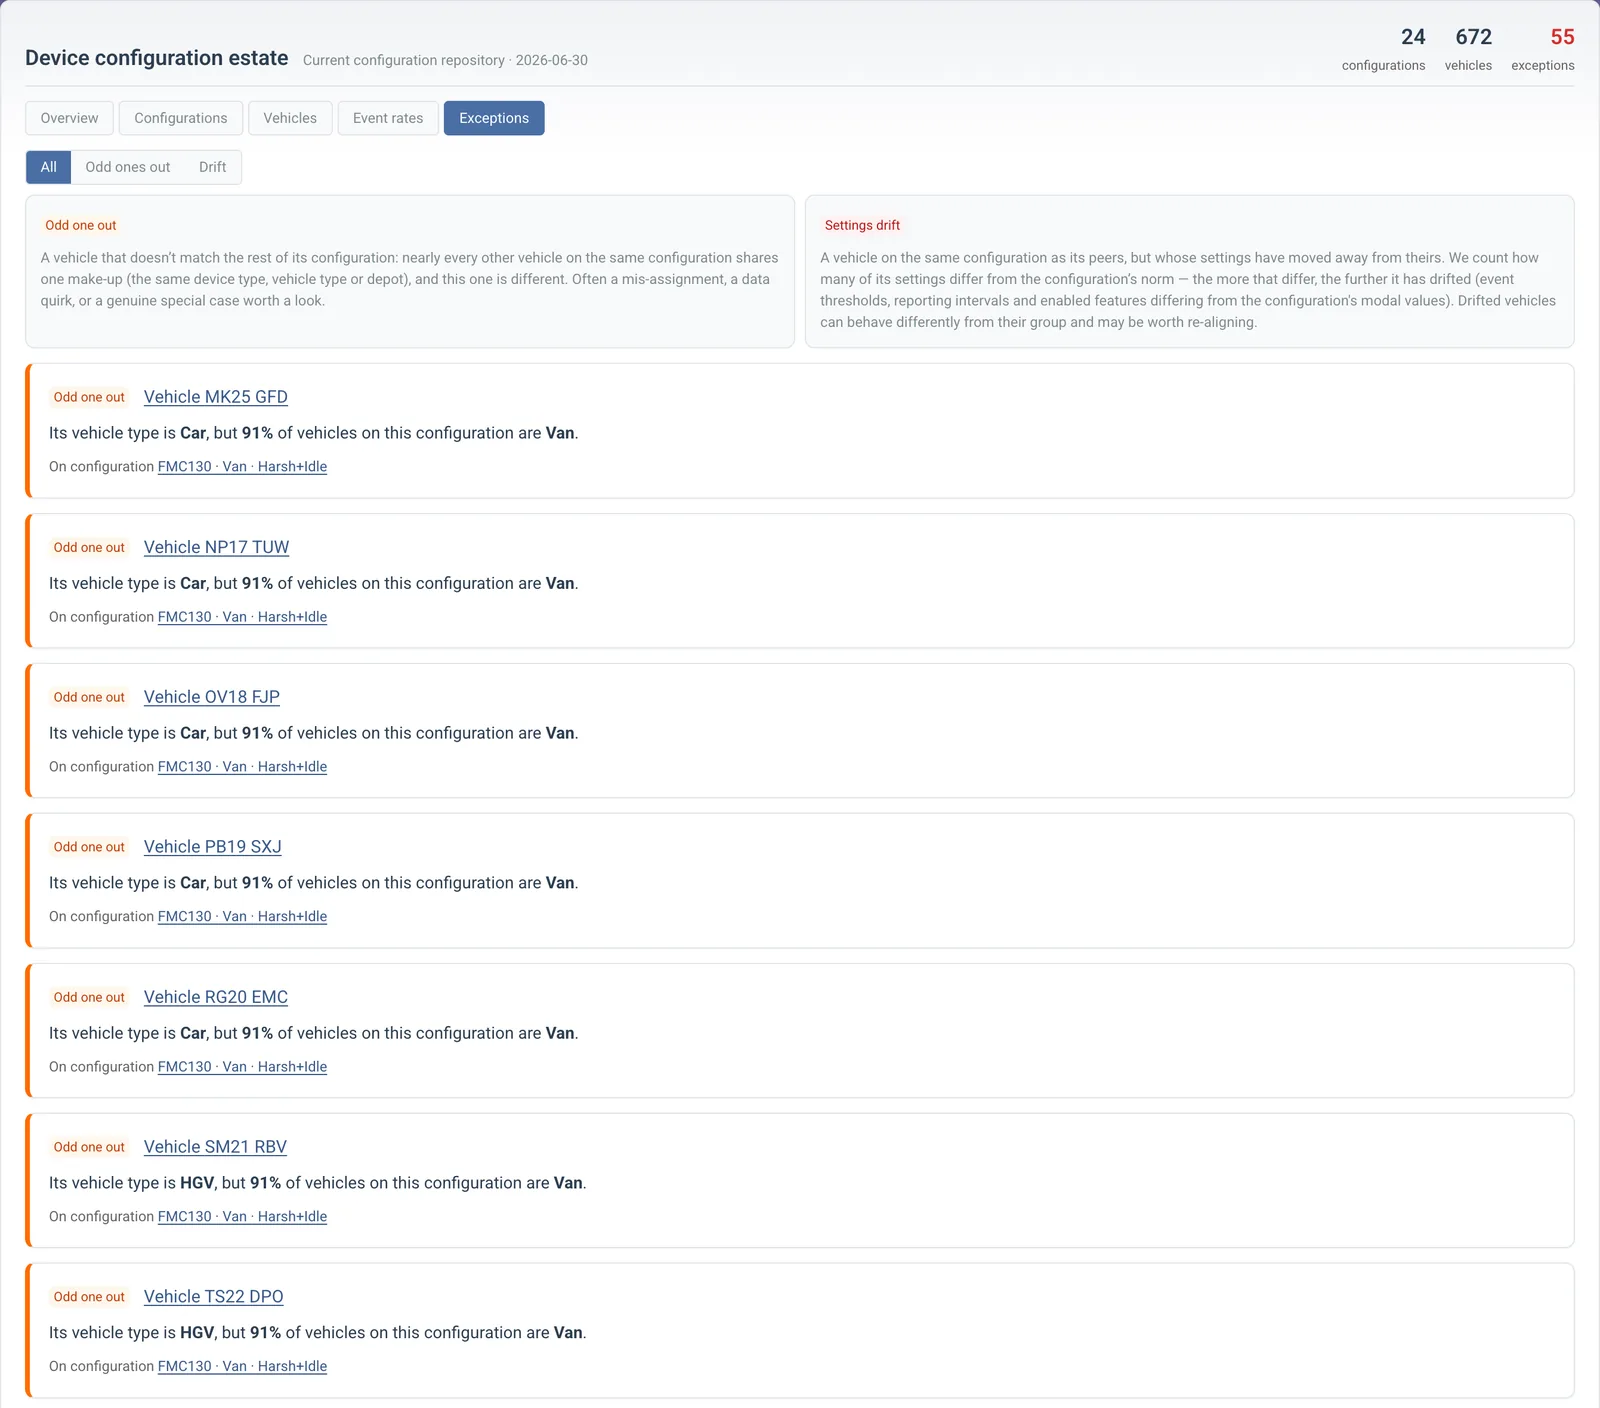
Odd ones out and settings drift
Every vehicle that does not match its configuration is listed with the reason: the wrong vehicle type for the group, the wrong device, or settings that have drifted from the group norm. Each one carries an Explore button, so the follow-up question is one click away.
- Composition outliers: a lorry on a van configuration
- Settings drift: how many settings differ from the norm and which
- Down to the vehicle: registration, make, model, year and drift score
Protecting your data
Works from the tables you already have
Trips, events, vehicles, drivers, fuel and configurations, wherever your telematics platform lands them. Dactana reads them where they are and never keeps a copy.
 Snowflake
 BigQuery
 Databricks
 PostgreSQL
 ClickHouseSQL ServerFiles and spreadsheets
Bring a fleet question
A full demo takes about half an hour. We will run your question live on fleet data.
Book a demo