
Financial services
Built for the questions
a bank asks.
Campaign response, contact strategy, risk and the customers behind them, each answered with checked figures and a recommendation you can defend to a regulator. Pick a question.
Campaign response
Who responds and who does not?
A deposit campaign question, answered with the components a marketing team actually uses: the campaign at a glance, response by segment, the months and channels that convert and the check behind every figure.
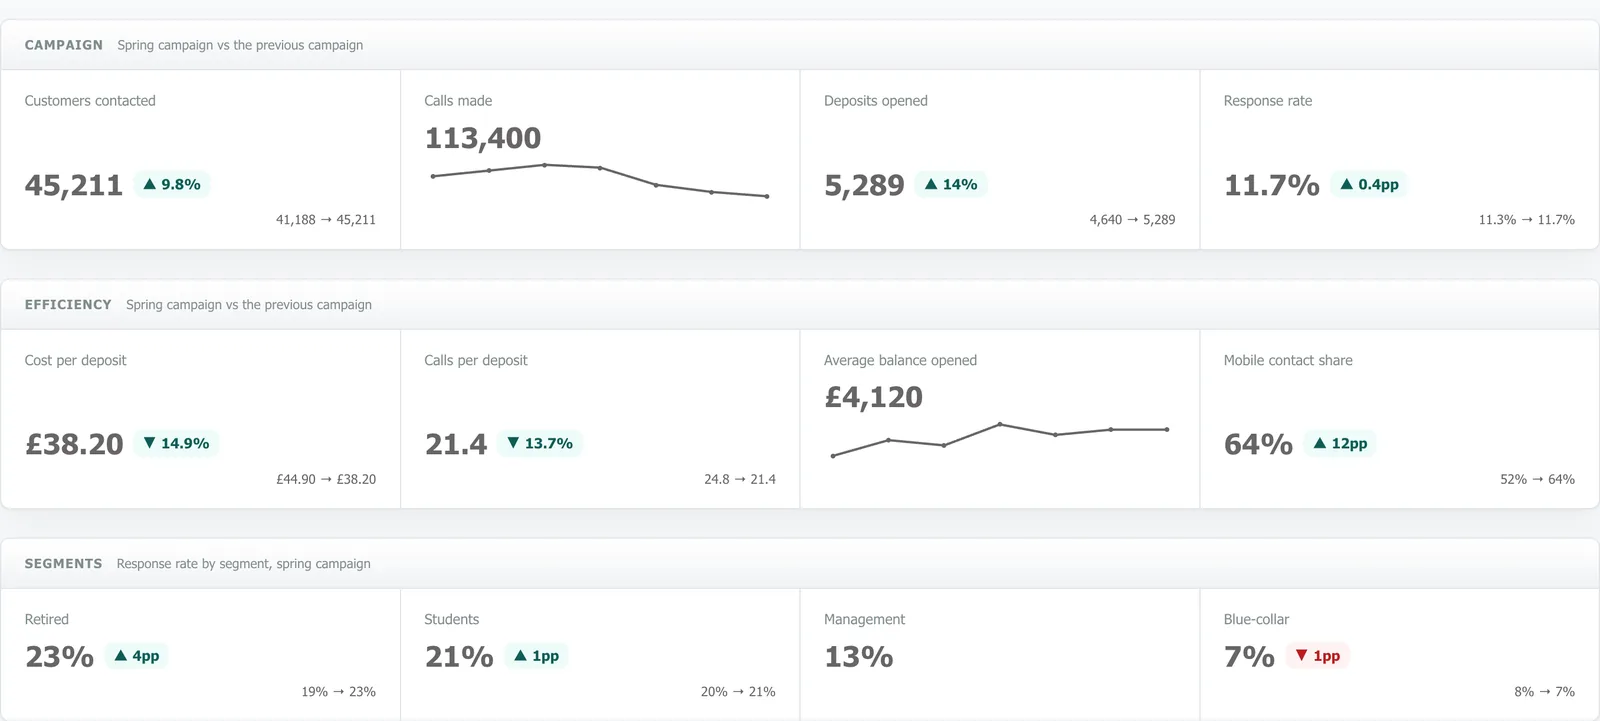
Response by segment
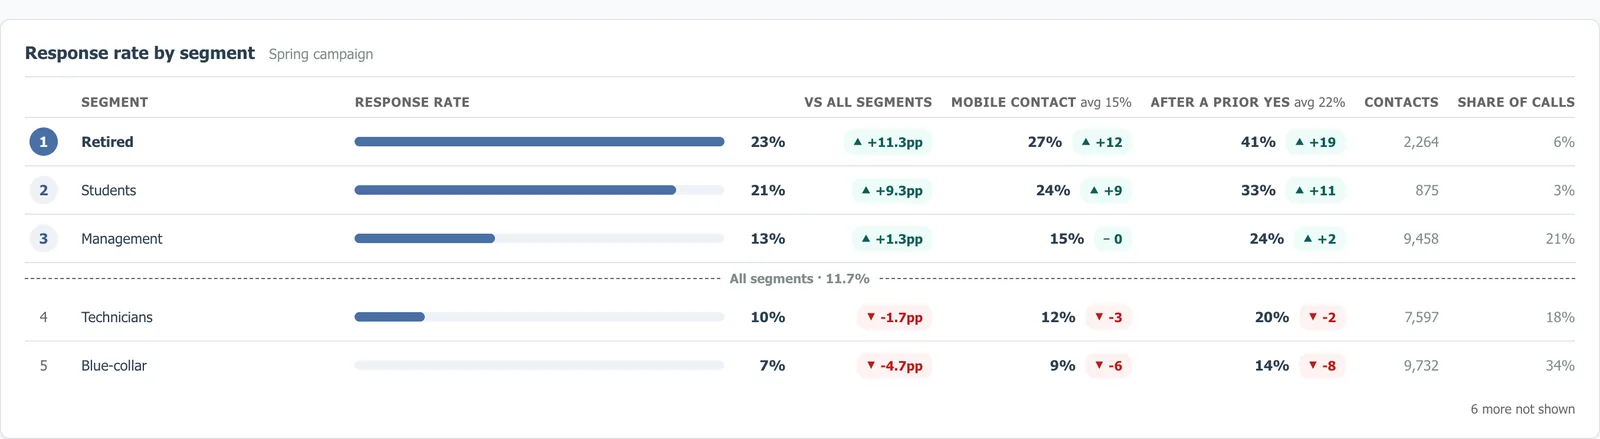
A leaderboard ranked against the campaign average, with the response after a mobile contact and after a previous yes beside it. Retired customers convert at twice the rate; blue-collar customers take a third of the calls for the lowest response.
- Ranked against the average, with the benchmark line where it falls
- Share of calls beside response, so effort and return sit together
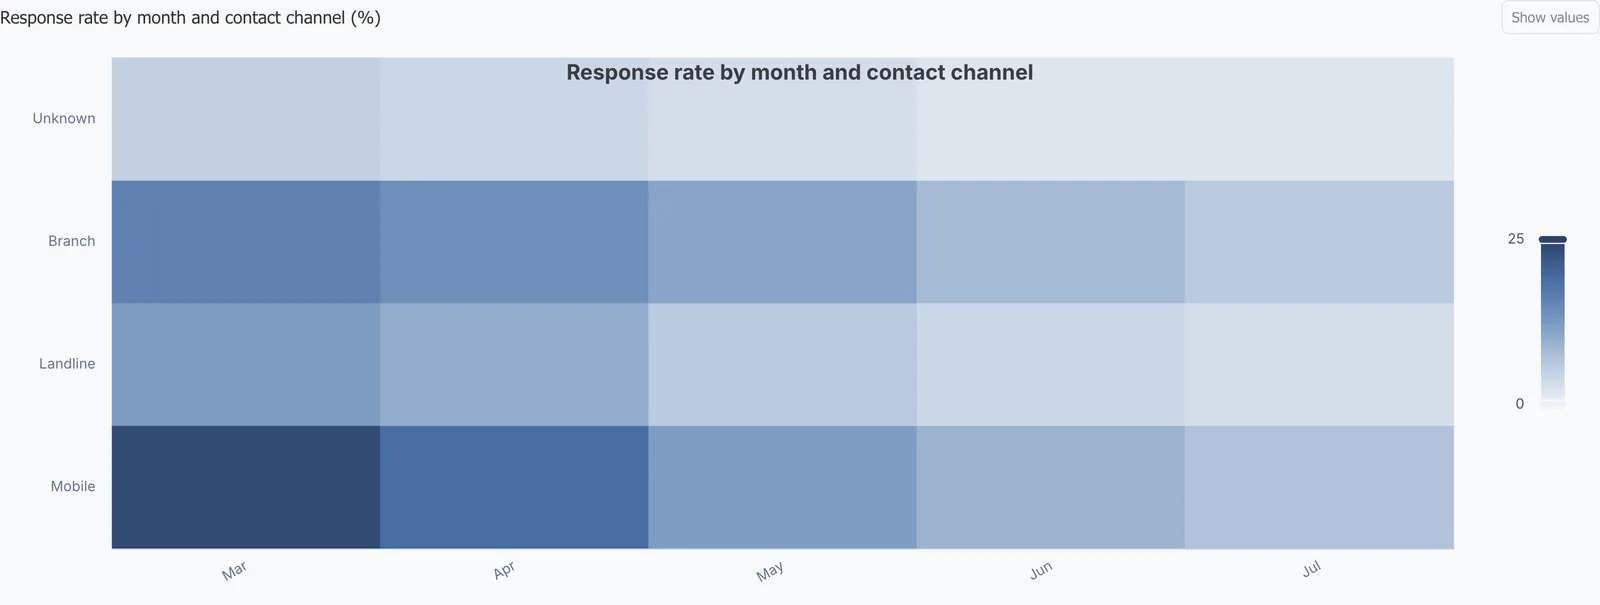
When and how to make contact
A heat map of response by month and channel shows mobile contact in spring converting at four times the rate of a summer landline call. Hover a cell for the figure and open the contacts behind it.
From key findings to the fact table
The same question as an explorer: key findings with their figures, the map, the heat map and the segment table, then audit view opening the table behind a claim and the check it passed.
The plan
How Dactana plans a campaign question
Before anything runs, Dactana drafts the steps and shows you what each will produce. Add the extras you want, drop what you do not, then go.
Refine it, then run it
A targeting question becomes three steps: response by segment, contact timing and channel and the effect of previous outcomes. Balance and product holdings join with one click and the complexity gauge shows what that costs.
Recommendations
Where should the next campaign go?
Every analysis closes with recommendations: what to do, why and the checked facts behind it. Assign them, track them and send them to the campaign board or your own systems.
Statement, rationale, evidence
Move a third of the blue-collar call volume to retired and student customers reached by mobile in spring. The rationale cites the response rates it rests on and each citation opens the evidence.
Credit and collections
Which accounts are drifting towards arrears and which treatment paths recover the most.
Fraud and disputes
Where disputed transactions cluster by channel, merchant type and time of day.
Product holdings
Which customers hold one product when their peers hold three and what they were offered.
Trust the output
Can we defend the answer?
When an analysis changes how customers are treated, a confident but wrong answer is expensive. Dactana is built so you can act on a result and defend it.
Every number comes from a query
Figures are produced by structured queries run directly against your data. Nothing is generated or estimated.
A validator checks each claim
A separate review pass re-runs the key numbers before a claim can appear. Claims that cannot be verified are corrected or removed.
Your data stays in your warehouse
Dactana connects with read-only credentials and runs where the data lives. Only the results leave and nothing learns from them.
Protecting your data
Works from the tables you already have
Customers, accounts, contacts, outcomes and transactions, wherever they live. Dactana reads them where they are with read-only credentials and never keeps a copy.
 Snowflake
 BigQuery
 Databricks
 PostgreSQL
 ClickHouseSQL ServerFiles and spreadsheets
Bring a campaign question
A full demo takes about half an hour. We will run your question live and show every check.
Book a demo