
Telecoms
Built for the questions
an operator asks.
Churn, complaints, network quality and the customers behind them, each answered with checked figures and a recommendation you can act on. Pick a question.
Churn
Where is churn concentrated and why?
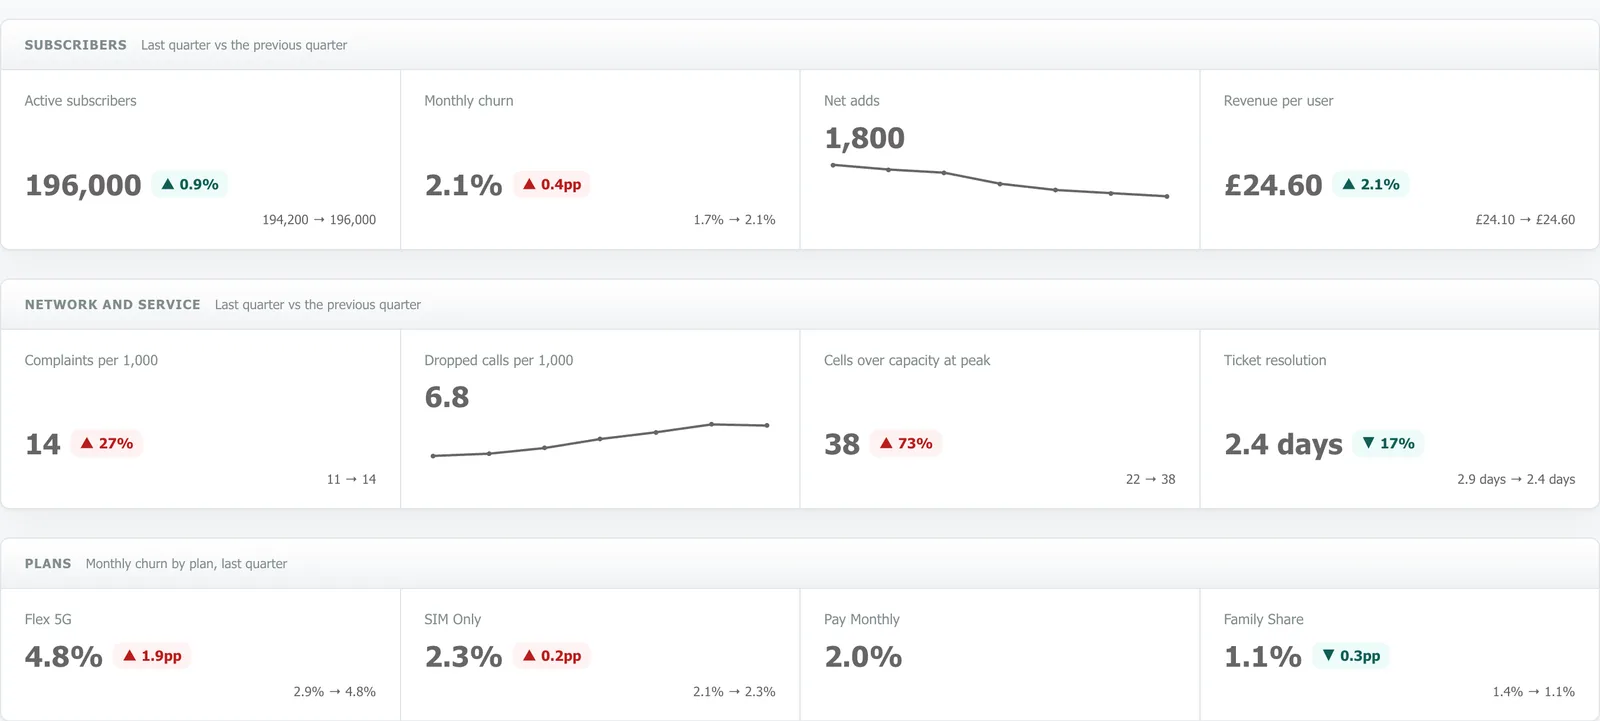
A retention question, answered with the components an operator actually uses: the base at a glance, churn by plan, the reasons customers gave and the check behind every figure.
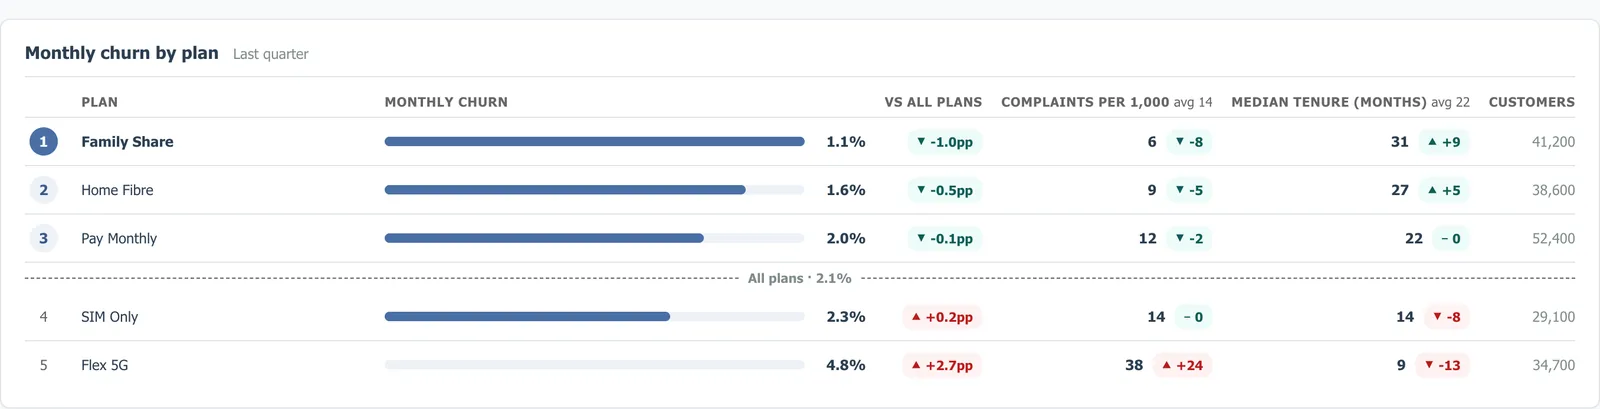
Churn by plan
A leaderboard ranked against the all-plans benchmark, with complaints per 1,000 and median tenure beside each plan. Flex 5G loses customers at more than twice the rate of any other plan and carries three times the complaints.
- Lower is better, so the stickiest plan leads
- Complaints and tenure alongside, so cause and effect sit together
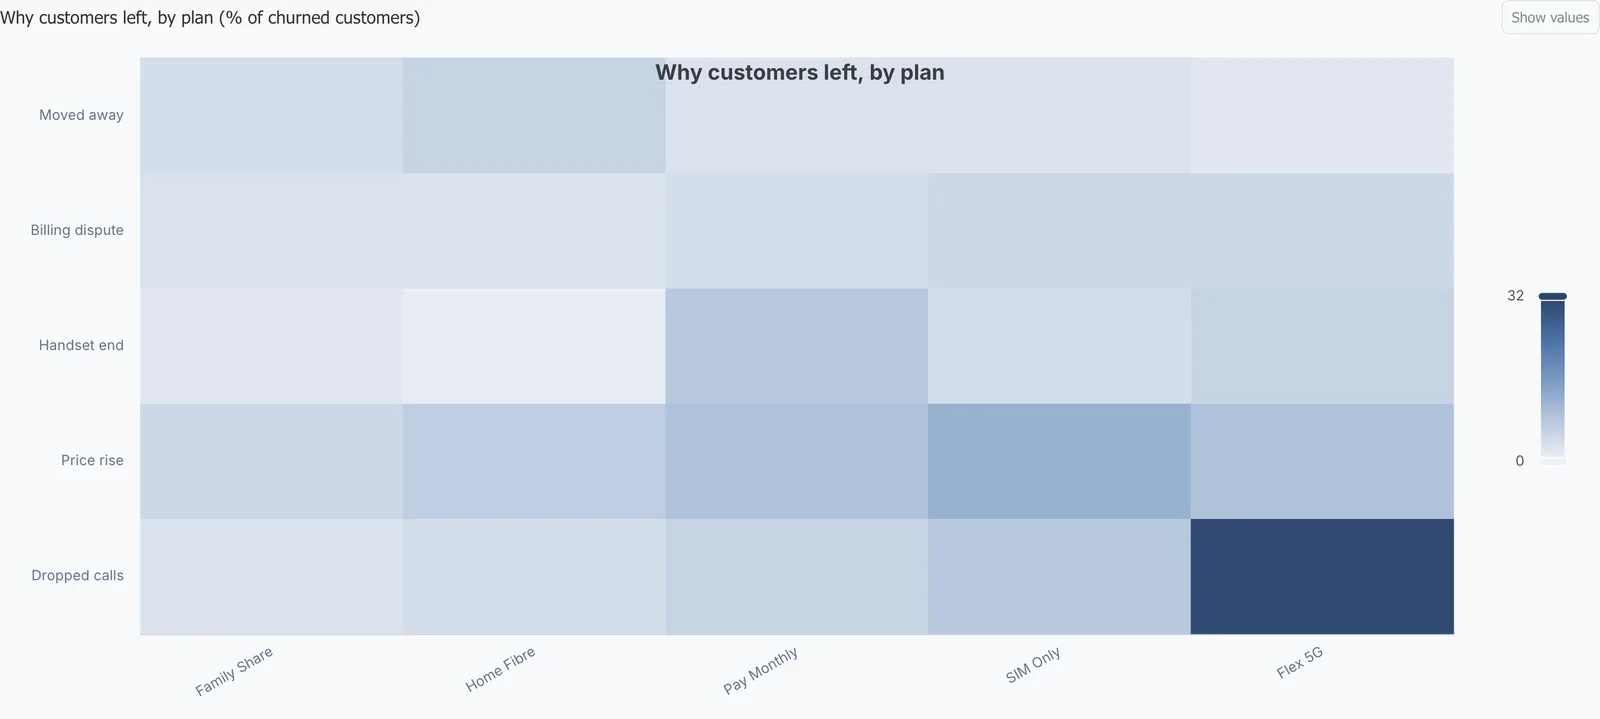
Why customers left
A heat map of leaving reasons by plan makes the Flex 5G problem obvious: dropped calls, not price. Hover a cell for the share and open the customers behind it.
From key findings to the fact table
The same question as an explorer: key findings with their figures, the map, the heat map and the plan table, then audit view opening the table behind a claim and the check it passed.
The plan
How Dactana plans a churn question
Before anything runs, Dactana drafts the steps and shows you what each will produce. Add the extras you want, drop what you do not, then go.
Refine it, then run it
A churn question becomes three steps: churn by plan and tenure, the drivers behind it and complaints against network quality. Retention offer candidates join with one click and the complexity gauge shows what that costs.
Network quality
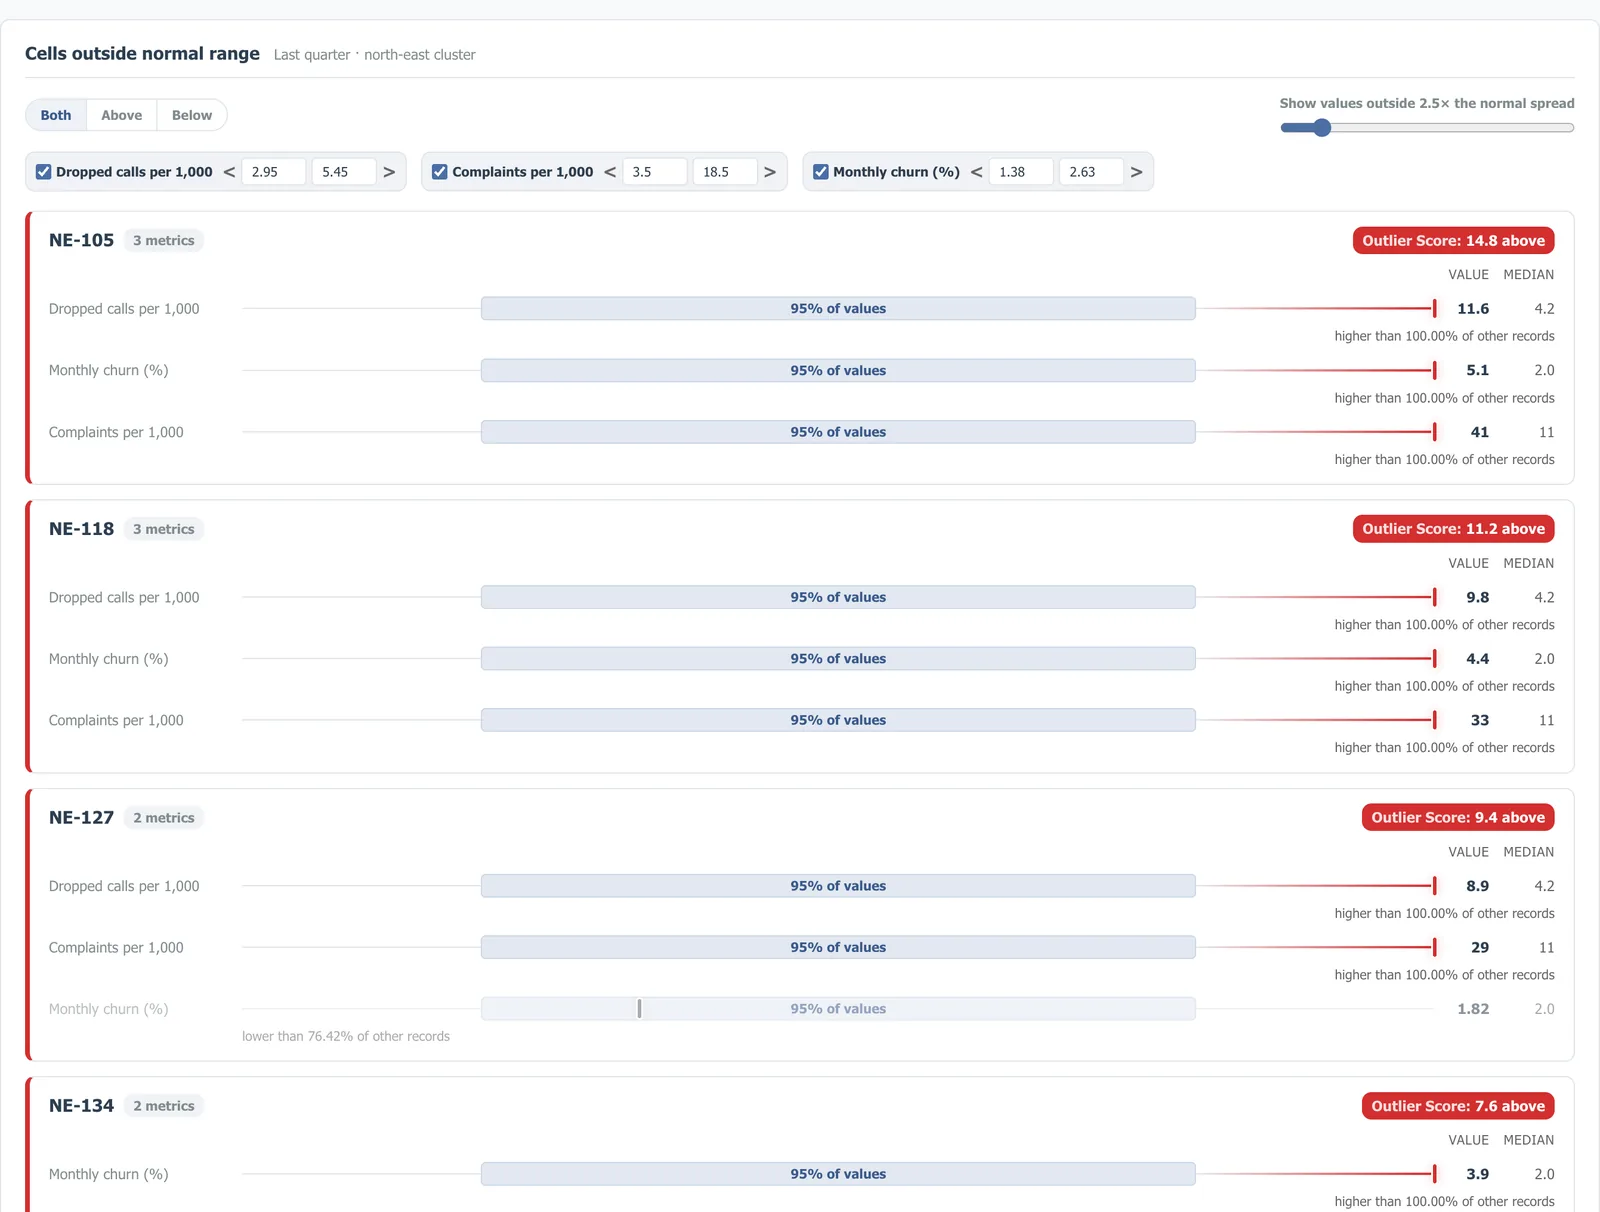
Which cells are behind the complaints?
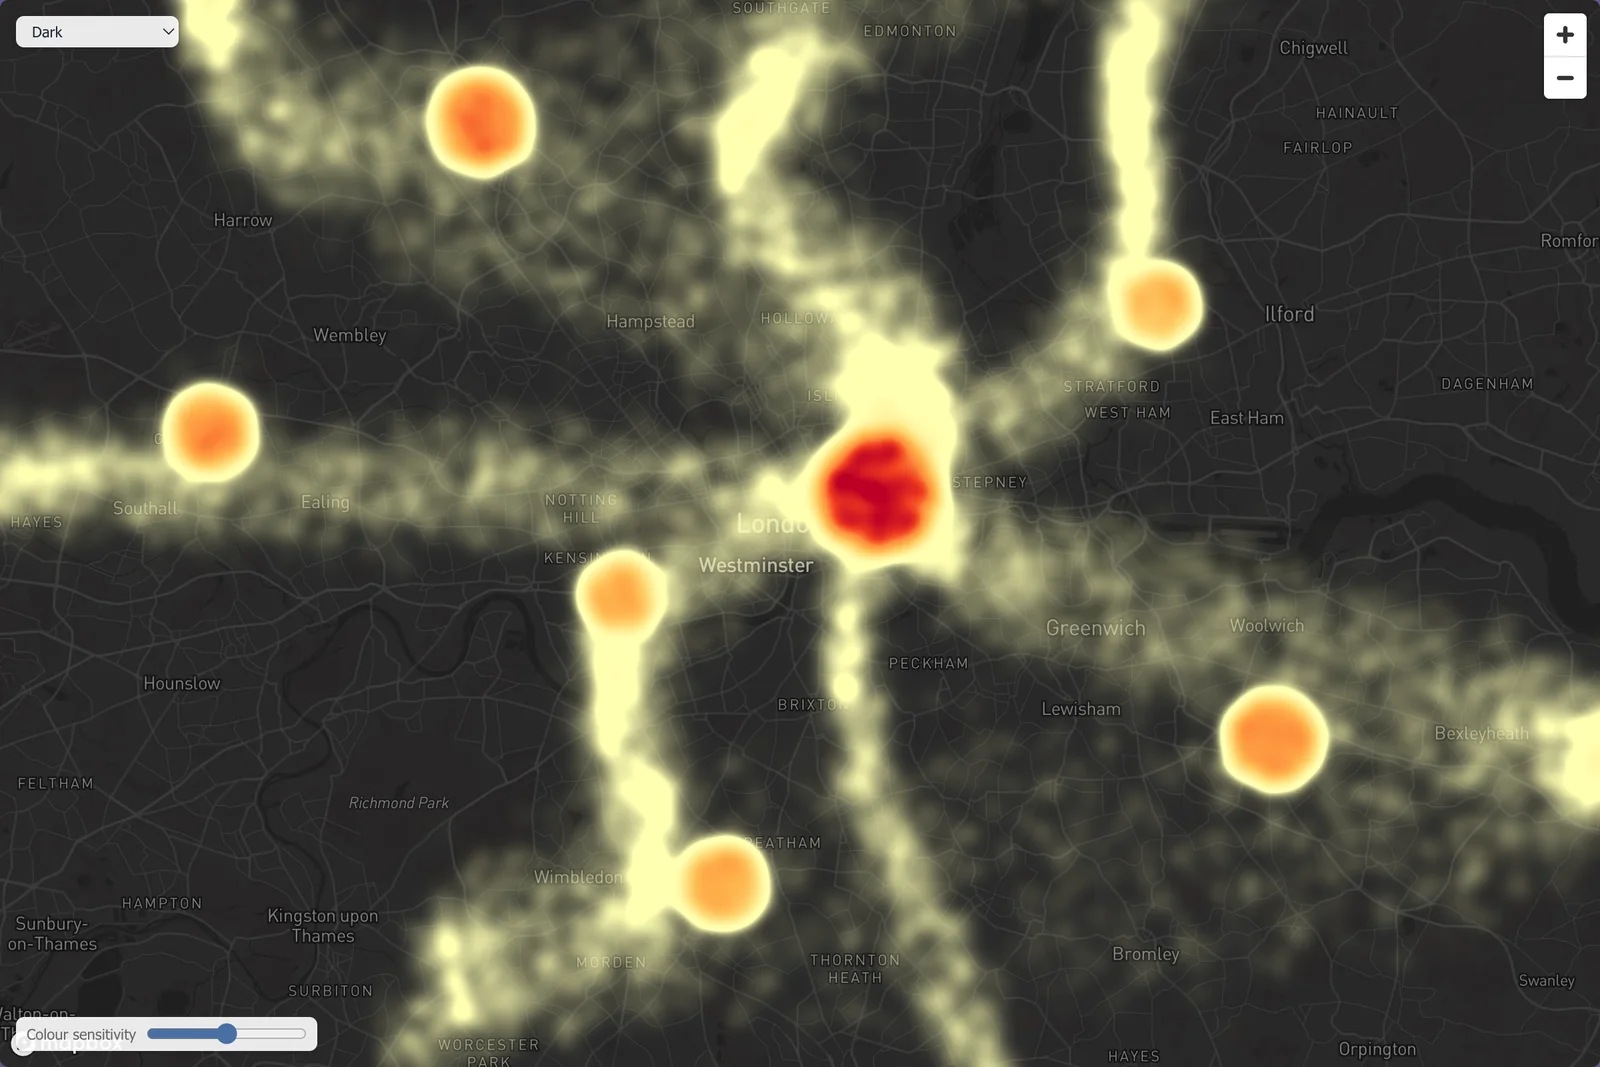
Complaints, dropped calls and churn by cell, so a network problem and a pricing problem stop looking the same.
Where the complaints cluster
The same cells on a real basemap as a heat map of complaint density, with the colour sensitivity under your control. Hover a cluster for the figure and open the cells behind it.
- Complaints, dropped calls or churn as the weight
- Cells, sites or postcodes as the grain
Plans and handsets
Which plan and handset combinations drive complaints and which quietly churn at contract end.
Usage and upsell
Which customers are close to a data cap every month and which offer they took last time.
Billing disputes
Where disputes cluster by plan, region and billing cycle and what they cost to resolve.
Recommendations
Who is worth a retention offer?
Every analysis closes with recommendations: what to do, why and the checked facts behind it. Assign them, track them and send them to the retention board or your own systems.
Statement, rationale, evidence
Offer Flex 5G customers in the north-east cells a network credit before their month-three review. The rationale cites the churn and complaint figures it rests on and each citation opens the evidence.
Protecting your data
Works from the tables you already have
Subscribers, plans, usage, tickets and cell quality, wherever they live. Dactana reads them where they are and never keeps a copy.
 Snowflake
 BigQuery
 Databricks
 PostgreSQL
 ClickHouseSQL ServerFiles and spreadsheets
Bring a retention question
A full demo takes about half an hour. We will run your question live and show every check.
Book a demo